


Your page builder sets a floor on your Core Web Vitals. You can optimize your way toward that floor, but you can’t get past it without changing the builder. That’s the short version.
We found this out on our own site. We rebuilt 330 live pages from Elementor into native Gutenberg and cut DOM depth by more than 60%.
Most of you aren’t on Elementor, so this article is about what that means for you. The mechanism comes first, our data second, and what to check on Divi, Bricks, WPBakery or Beaver Builder after that.
The question underneath “gutenberg vs elementor”
Most page builder comparisons are feature lists: which one has better templates, which has a nicer editor, which costs less. Those are fair things to ask, but they’re not what this piece is about.
What we’re looking at is structural. What does your builder put into the HTML of every page, and what does that cost you in Core Web Vitals? That cost stays fixed until you change the builder.
Here’s the argument in one line. Elementor isn’t slow. On a site edited daily, a builder that regenerates global CSS every time you publish makes caching almost impossible to hold.
If you edit your site twice a year, almost none of this applies to you. Read the three checks in the middle and stop there. If your team publishes several times a week, this is probably your problem.
What page builders actually do to your pages
Every visual builder trades markup for convenience. To let you drag a box inside a box, it wraps your content in container elements you never see.
On our site, Elementor wrapped basic text and images in a chain of them: section, then column, then widget-wrap, then widget. A single image sat inside four of them.
Every one of those wrappers is a node in your page’s DOM tree. And DOM size isn’t a vanity metric.
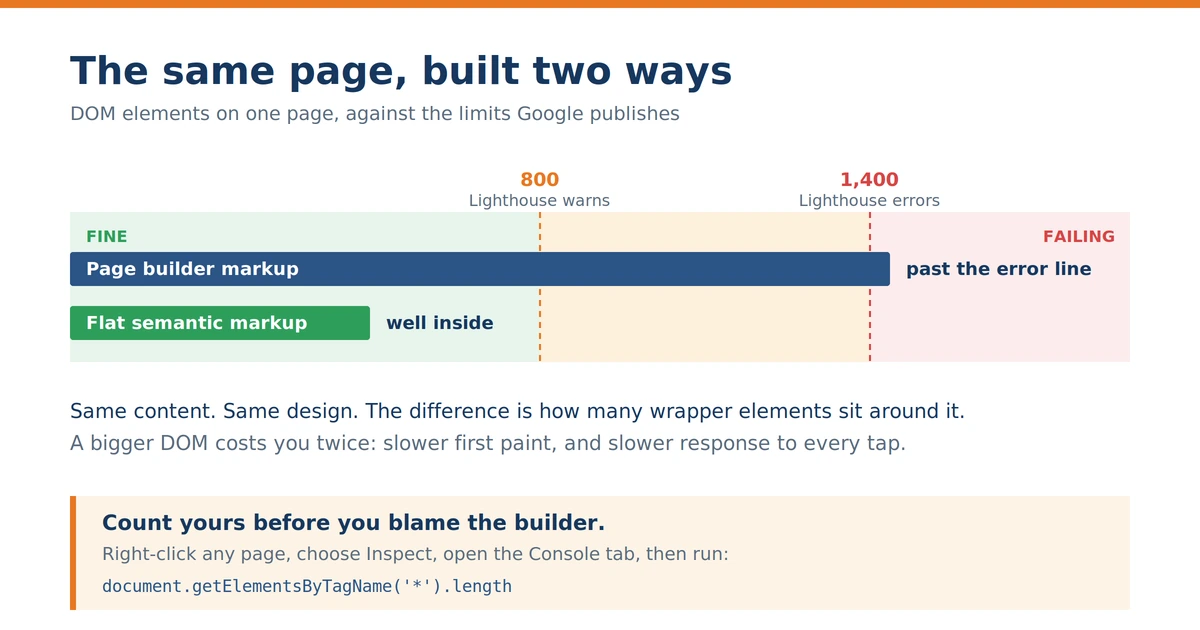
Google publishes thresholds for this. According to Google’s guidance on DOM size, Lighthouse starts warning when a page body goes past roughly 800 elements and reports an error above roughly 1,400. Chrome’s newer Optimize DOM size insight flags heavy style recalculation and layout work directly.
A large DOM doesn’t just slow the first paint. Google’s documentation on DOM size and interactivity explains that it increases style calculation time and layout cost on every interaction, which is what Interaction to Next Paint measures. It also uses more memory, and that hits mid-range phones hardest.
So wrapper markup costs you twice. Once in how fast the page shows up, and again in how fast it reacts when somebody taps something.
What to check on your own site
Count the DOM elements on your heaviest page. Right-click, Inspect, open the Console tab, then paste in document.getElementsByTagName(‘*’).length and hit enter. Takes about thirty seconds.
Do it on the page template that repeats most. A course listing, a product grid, a blog archive. Those are where wrapper overhead multiplies, because every extra container gets rendered once per item on the page.
Over 800 is a warning. Over 1,400 is a problem. This works on any builder, and on no builder at all.
The second cost: what happens when you hit publish
This one’s less obvious, and it did us more damage than the DOM size did.
Our site was built on a shared global CSS file, one central stylesheet keeping a consistent look across our custom plugins. Over the years, page-specific design fixes got appended to it. Everything ended up depending on one file.
So editing any single page regenerated that global CSS. Our caching layer read it as a site-wide change and cleared the cache for every page.
A full cache rebuild took up to 6 hours. Our content and marketing teams were making 6 to 8 edits a day.
The cache was getting wiped several times before it could finish rebuilding. In isolated tests our scores looked excellent. In practice, almost nobody was served a cached page.
There was a related problem the caching layer couldn’t solve. Even a basic page like our About Us needed enough JavaScript to be a problem. A caching plugin compressed it and total load time did improve. But the caching layer couldn’t resolve critical CSS properly, so pages render-blocked and sat blank until the full stylesheet loaded.
One fix, another failure. That was the year.
We’ve written the full account of that period, including all three caching plugins we tried and what each one broke, in part one of our Core Web Vitals guide.
Also read: Why a scaling site still feels slow after caching: diagnosing render-blocking resources Caching shortens the trip from your server to the browser. It doesn’t reduce the work waiting at the other end, which is why a cached page can still arrive blank.
Also read: Async, defer and module loading: how to stop JavaScript blocking your pages If render-blocking scripts are your problem too, this covers the loading strategies that help.
We tried everything at the caching layer before we accepted the problem was underneath it. Here’s what changed when we finally moved the pages themselves.
What we measured moving 330 pages off Elementor
Native Gutenberg generates flat, semantic HTML5. No wrapper chain.
Rebuilding in Gutenberg cut our DOM depth by more than 60%.
Two other things changed, and both mattered as much as the DOM number.
Assets started loading conditionally. Gutenberg only enqueues a block’s CSS and JavaScript on pages where that block exists, instead of loading big libraries site-wide. That removed the global CSS inflation at its source, which meant editing one page stopped invalidating every other page.
Ordinary caching also started working again, which was the part we had stopped expecting. Staging benchmarks confirmed that once Elementor was out, standard server caching held green metrics across the domain with no SaaS layer on top.

Before anyone points out that Elementor has performance settings, we know. We were running them.
We exhausted Elementor’s own performance toolkit first
The easy version of this article would be that Elementor is bloated and Gutenberg isn’t. That version is out of date, and any Elementor user would rightly dismiss it.
Elementor has shipped real performance work, and we had it turned on.
| Elementor feature | What it does |
| Flexbox Containers | Replaces the section, column and inner-section nesting with a single container element. Fewer wrappers by default. |
| Optimized Markup / Optimized DOM Output | Strips wrapping div layers from widget output. Introduced from Elementor 3.0 and expanded in 3.25. |
| Improved Asset Loading | Unused widget scripts don’t load. |
| Improved CSS Loading | Cuts the default CSS payload per page. Elementor’s own changelog cites savings of up to 126KB per page load from adding WooCommerce and Theme Elements widgets to this experiment. |
| Conditional library loading | Swiper.js and similar libraries load based on widget dependencies rather than on every page. |
These are genuine improvements, and on a newer site they would probably have been enough. They weren’t for us, and the reason is specific.
The catch that Elementor documents itself
The DOM optimization is built for new sites. Elementor’s own help documentation says the feature includes markup changes that may affect custom code, and that if your custom code is affected you’ll need to rewrite your CSS around the new HTML structure. It describes the improvements as boosting performance for new Elementor websites.
The Elementor developer notes are just as clear that the wrappers only come off if the experiment is active on that site, and they recommend reviewing your code for uses of the wrapper classes being removed.
So the fix exists. On an established site carrying years of pages and custom CSS built around the old structure, turning it on risks breaking live layouts. That’s why this became a rebuild decision instead of a settings decision.
Elementor can be made fast. That part isn’t in dispute. What failed was keeping it fast across 330 pages under 6 to 8 edits a day, and no toggle touched the global CSS invalidation underneath.
The question to ask before you turn anything on
Most builders now ship performance settings that reduce their own markup. Before you enable one, ask your developer whether it changes the HTML structure, and whether any of your custom CSS depends on the old structure.
On a site built in the last year, the answer is usually no and you can switch it on.
On a site that’s been running for five years with custom styling layered on top, the answer is usually yes. Test it on a staging copy. Enabling it on production is how people break their own layouts on a Friday afternoon.
This applies to Divi, Bricks and WPBakery too. They all have some version of this setting, and they all carry the same risk on an older site.
None of which helps if you’re not on Elementor. So here’s what we can and can’t tell you about the others.
And beyond: what this means on Divi, Bricks, WPBakery or Beaver Builder
We have production data on one migration, Elementor to Gutenberg. We haven’t benchmarked the others, and we’re not going to pretend otherwise.
What we can tell you is what’s publicly documented about how each one generates markup, because the mechanism above applies to all of them.
Divi
Divi 4 renders through shortcodes wrapped in divs. Elegant Themes’ own blog admits that when the builder is deactivated the content is left wrapped in shortcodes, which makes moving away difficult.
Divi 5 addresses this directly. Elegant Themes says it removes shortcode processing entirely and adopts an HTML5-based storage format aligned with the block editor, alongside critical CSS loading and a dynamic framework that only loads the code a page uses. Those are the vendor’s own claims and we haven’t tested them ourselves.
If you’re on Divi 4, your migration cost is higher than an Elementor one, because the shortcode markup is sitting inside your content.
Bricks
Bricks stores layout data as JSON and renders it through PHP templates at request time rather than through shortcodes. Structurally that avoids the shortcode processing overhead and tends to produce cleaner output. We have no production measurements of our own.
WPBakery
WPBakery, formerly Visual Composer, is the oldest of these and is shortcode-based in the same way Divi 4 is. It’s also the one losing ground fastest. If you’re on it, the question is usually not how to optimize it but when you’re replacing it. We wrote about Visual Composer back when it was the default choice, which gives you a sense of how long this markup has been accumulating on some sites.
Beaver Builder
Beaver Builder has a reputation for being light and stable. It doesn’t try to match the bigger widget libraries, and that’s mostly the point. The wrapper question still applies though, so run the checks below instead of trusting the reputation.
Where this hits hardest, by what your site does
If you run courses or a learning platform: most of your real usage happens behind a login, and logged-in users normally bypass page caching altogether. So a caching plugin makes your marketing pages fast and does nothing for the course experience your learners pay for. Check the speed of a lesson page while logged in, not your homepage while logged out. Your builder markup matters more here, not less, because there’s no cache sitting in front of it.
If you run a store: your cart, checkout and account pages are excluded from caching for the same reason. And product grids are interaction-heavy, so INP is usually your failing metric rather than LCP. Test a filtered category page on a mid-range phone, tap a filter, and count. That’s the number your customers feel.
If you run a content or marketing site: caching does most of the work for you, which is why the publishing question matters more than the markup one. Start with check two below.
The common thread: work out which of your pages can’t be cached, and look at those first. That’s where your builder’s markup is doing full-price damage.
Three checks you can run on your own site today
These work on any builder, and they’ll tell you more than any comparison article, including this one.
1. Count your DOM elements. Open your heaviest page, right-click and inspect, then run document.getElementsByTagName(‘*’).length in the browser console. Over roughly 800 is a warning sign. Over roughly 1,400 is a problem.
2. Test what one edit does to your cache. Make a trivial change to a low-traffic page and publish it. Then check whether your cache cleared for that page only or for the whole site. If it’s the whole site, time a full rebuild and compare that to how often your team publishes.
3. Check whether assets load conditionally. Look at the network tab on a simple page, a contact page or an about page. If you’re loading slider libraries, form scripts or carousel CSS on a page with none of those things, your builder is loading site-wide rather than per page.
If check two comes back as a full-site purge and your team edits daily, no caching plugin will fix your Core Web Vitals. The problem sits above the caching layer.
Got your numbers and not sure what they add up to?
Send us what the three checks returned. We'll tell you whether it's your builder, your stack, or something simpler.
Also read: Debugging WordPress performance issues: a systematic approach A wider process if the three checks come back clean and your site is still slow.
If you’d rather start with a broad read before running these manually, our free site speed analyzer gives you a starting point in about a minute.
Say the checks come back badly. That still doesn’t automatically mean rebuild.
So should you migrate?
For most sites, no. We want to be direct about that, because a rebuild is expensive and for a lot of readers the builder isn’t the problem.
What decides it is how often you publish and how much else your site is wired into. Page count barely comes into it.
| Your situation | What we’d actually say |
| Brochure site, 20 to 40 pages, edited monthly | Stay where you are. Turn on your builder’s own performance features on a staging copy first. You’ll probably never hit the invalidation loop. |
| Content site, edited weekly, few integrations | Run the three checks. If your cache survives an edit, optimize instead of rebuilding. |
| Site edited several times a week, growing | This is where the math starts turning. Time your cache rebuild against your publishing rate before you decide. |
| Complex site, multiple integrations, daily edits, high-traffic events | This is where we ended up. Optimization buys time. It doesn’t remove the floor. |
Also read: When to move beyond WordPress customization templates Your builder adds code to every page. So does your theme. On a lot of sites the theme is the heavier of the two, so check both before you decide the builder is at fault.
It’s also worth ruling out the layers underneath before you blame markup at all. PHP 8 performance tuning and OPcache covers the server side, and our guide to monitoring WordPress performance covers how to watch any of this over time.
If you’ve run the checks and the problem turns out to be structural, that’s when it’s worth talking to someone. Our website speed and scale optimization work starts with finding what’s actually holding a site back at the infrastructure level, which is usually where this ends up.
What a migration actually involves
Briefly, so you can size it.
● Every page built in the old builder gets rebuilt. There’s no reliable automatic conversion between builders that preserves layout.
● Custom CSS written against the old wrapper classes has to be rewritten.
● Templates get standardized on the way through, or you rebuild the same problem in a new tool.
● If you’re on a shortcode-based builder, your content is carrying markup that has to be cleaned, not just moved.
That’s a lot of real work, which is exactly why the three checks matter before you commit to any of it.
How to get a real number before you decide
Ask a developer to rebuild two pages, not the whole site. Pick your heaviest template and one ordinary page. Time both.
That gives you a per-page figure you can multiply, and it tells you something a quote can’t: whether your content moves across cleanly or fights you.
Then put that total against what you’re already spending each year on tools that hold the line without fixing anything. For a lot of growing sites those two numbers are closer than expected.
Before you commit to a rebuild, get the actual number.
We can help you rebuild two of your pages, the heaviest template and one ordinary page, and time both. You get:
- A per-page figure you can multiply across your site
- Whether your content moves cleanly or fights the migration
- A straight answer on whether targeted work gets you there instead

Where each layer landed for us
For context, these are the two rows from our own comparison that matter for a builder decision. The full table, including the three caching plugins, is in the guide.
| Layer | LCP behavior | Real-world INP | Cache status | Removes the underlying bloat? |
| Airlift (SaaS engine) | Very high, 2.4s average | Very good, 118ms average | Optimized, whitelist engine | Moderate |
| Native Gutenberg | Optimal, native speed | Optimal, minimal JS | Native caching support | Maximum, zero bloat |
Airlift is a commercial product from BlogVault. We’re describing what worked for us, not recommending a purchase.
A few things people ask us when this comes up.
Frequently asked questions
Is Gutenberg actually faster than Elementor?
On markup output, yes. Gutenberg generates flat semantic HTML and only loads block assets where the block exists, while Elementor adds wrapper layers and, by default, broader asset loading. Whether that makes your site faster depends on your theme, hosting and how much custom code sits on top.
Can I just turn on Elementor’s Optimized Markup instead of migrating?
On a new site, yes, and you should. On an established site, Elementor’s own documentation warns that the markup changes may break custom code and that you’ll need to rewrite CSS around the new structure. Test it on a staging copy before touching production.
Does switching page builders hurt my SEO?
Not by itself. Rankings respond to what changes, not to which tool produced it. The risk comes from URLs changing, content getting dropped, or layouts shifting during the rebuild. Keep URLs stable and content intact and the migration is neutral to positive.
Is Elementor losing market share?
Not in the way most articles claim. Elementor’s share of the builder category has fallen because the category grew and new builders entered. Its share of WordPress sites has kept rising, just more slowly than it used to. Both statements are true and they use different denominators.
I use Divi, not Elementor. Does any of this apply?
The mechanism does. Run the three checks in this article. If a single page edit clears your whole cache and your team publishes often, you’ve got the same structural problem regardless of which builder produced it.
My builder is fine. Why is my site still slow?
Plenty of reasons that have nothing to do with markup: database load, server configuration, third-party scripts, unoptimized images. The three checks are designed to rule the builder in or out quickly so you don’t spend months on the wrong layer.
Where this leaves you
Page builders aren’t the enemy. They let small teams ship work that would otherwise need a developer, and for a lot of sites that’s a fair trade.
But the convenience has a fixed cost in markup, and on a site that gets edited often that cost keeps adding up until no plugin can clear it. Run the three checks. If your cache survives an edit, optimize and get on with your life.
If it doesn’t, part two of our Core Web Vitals guide covers what we actually did about it, including what held and what we’d do differently.
Also read: Beyond Core Web Vitals: the metrics that actually matter Once the builder question is settled, these are the other numbers worth watching.
And if you’ve run the checks and want someone to look at the structure properly instead of selling you another plugin, here’s how we at WisdmLabs work:
4. A 30-minute call. We work out what’s actually happening. No deck, no upsell.
5. A clear scope. What the work involves, how long it takes, what it costs, before anything starts.
6. We do the work. You’re involved where your input matters.
7. You review; we launch. Nothing goes live until you’re happy.
8. You own it. Everything is documented and handed over.