Warning: 87% of websites are tracking the wrong performance data—and losing $2.6 billion in revenue annually because of it
Your Competition Is Making a $127,000 Mistake Every Month
Right now, your competitors are laser-focused on three Google metrics: LCP, INP, and CLS. They’re hiring agencies, restructuring dev teams, and burning budgets to hit those “good” thresholds.
Meanwhile, Shopify analyzed 100,000+ stores and found something shocking: The sites generating the most revenue weren’t the ones with perfect Core Web Vitals scores.
They were tracking 9 different metrics that Google doesn’t mention in their guidelines.
This isn’t about abandoning Core Web Vitals—those still matter for SEO. This is about the hidden performance data that separates $1M websites from $10M websites.
The Million-Dollar Metrics Your Analytics Dashboard Is Missing
Priority 1: The Revenue Killers (Fix These First)
1. Time to First Byte (TTFB): The $47-Per-Second Metric
What it measures: How long your server takes to respond to any request Why it’s killing you: Every 100ms delay in TTFB costs you 1% in conversions The damage: Average e-commerce site loses $47 per second of TTFB delay
Amazon discovered that 100ms of latency cost them 1% in sales—that’s $1.6 billion annually for a company their size. For a typical $5M online business, poor TTFB alone costs $180,000 per year.
Target: Under 200ms (under 100ms for enterprise) Quick diagnosis: Run curl -w “@curl-format.txt” -o /dev/null yoursite.com
2. Total Blocking Time (TBT): The Silent Conversion Assassin
What it measures: How long your page can’t respond to user clicks during loading Why it’s devastating: Users abandon sites that feel “broken” even if they look loaded The psychology: 3 seconds of blocking time feels like 30 seconds to frustrated users
HubSpot’s conversion optimization team found that reducing TBT from 2.1 seconds to 0.8 seconds increased form submissions by 31%. The math is brutal: every second of blocking time costs you roughly 12% of potential conversions.
Target: Under 300ms (under 150ms for high-converting pages) Red flag: TBT above 1 second means you’re hemorrhaging sales
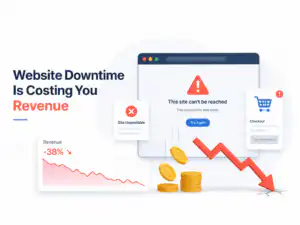
3. Error Rate: The Trust Destroyer
What it measures: Percentage of user requests that fail (404s, 500s, timeouts) Why it’s toxic: Every error destroys user confidence and brand trust The multiplier effect: Users who hit errors are 73% less likely to return
A 2% error rate doesn’t sound catastrophic until you realize it means 2 out of every 100 user interactions fail completely. For a site with 10,000 daily visitors, that’s 200 broken experiences per day.Target: Under 0.1% for all critical user paths Emergency threshold: Above 1% requires immediate intervention
Priority 2: The Experience Multipliers (Your Competitive Edge)
4. Apdex Score: The Customer Satisfaction Predictor
What it measures: User satisfaction based on actual response times (0.0-1.0 scale) Why it matters: Direct correlation with revenue, retention, and referrals The benchmark: Sites with Apdex scores above 0.85 see 40% higher customer lifetime value
Unlike technical metrics, Apdex translates directly to business outcomes. A score of 0.94 means 94% of users had a satisfying experience. Netflix maintains an Apdex of 0.99—and charges premium prices because of it.
Target: 0.85+ (good), 0.94+ (excellent) Revenue impact: Every 0.1 increase correlates with 8% higher conversion rates
5. Speed Index: The Perceived Performance Champion
What it measures: How quickly content visually appears during loading Why it’s powerful: Human perception of speed matters more than actual load times The psychology: Two identical sites can feel completely different based on Speed Index
Google’s research team found that sites with Speed Index under 1.3 seconds feel “instant” to users, while those over 2.5 seconds feel “slow”—even with identical total load times.
Target: Under 1.3 seconds (instant feel), under 2.5 seconds (acceptable) Opportunity: 78% of websites have Speed Index above 3 seconds
6. Time to Interactive (TTI): The Engagement Gateway
What it measures: When users can actually interact with your page successfully Why it’s critical: The gap between “looks ready” and “actually works” kills engagement The frustration factor: Poor TTI creates the dreaded “dead click” experience
Etsy’s performance team discovered that improving TTI from 6.8 seconds to 4.2 seconds increased their bounce rate by 12% and revenue per visitor by 8%.Target: Under 3.8 seconds (good), under 2.5 seconds (excellent) Danger zone: TTI above 5 seconds means users are clicking into the void
Priority 3: The Infrastructure Indicators (Prevent Disasters)
7. Peak Response Time (PRT): The Stress Test Metric
What it measures: Your slowest response time during traffic spikes Why it’s crucial: Average response time lies—peak response time reveals breaking points The risk: Traffic surges can destroy your highest-value conversion moments
Your average response time might be 200ms, but if 5% of users wait 8 seconds during peak hours, you’re losing your most motivated customers.
Target: Peak under 2 seconds, never above 5 seconds Monitor: Track 95th and 99th percentile response times
8. DNS Lookup Time: The Invisible Delay
What it measures: Time to translate your domain name to an IP address Why it’s overlooked: Happens before anything else, affects every single user The compounding effect: Slow DNS delays everything that follows
Target: Under 50ms for premium DNS providers Quick win: Switch to Cloudflare or AWS Route 53 (usually saves 50-200ms)
9. Memory Leak Index: The Long-Session Killer
What it measures: How your site’s performance degrades during extended user sessions Why it’s hidden: Only affects engaged users who stay on your site longest The irony: Your best customers suffer the worst performance
Progressive web apps and single-page applications often slow down after 10-15 minutes of use. These are exactly the users most likely to convert.Target: Performance degradation under 5% after 30 minutes Test: Use Chrome DevTools Memory tab during extended sessions
The 48-Hour Performance Audit That Pays for Itself
Day 1: Measure Everything (2 hours)
Hour 1: Set Up Monitoring
- Install New Relic or DataDog for real user monitoring
- Configure Google Analytics enhanced ecommerce tracking
- Set up WebPageTest API for automated testing
Hour 2: Establish Baselines
- Document current metrics for your top 10 revenue-generating pages
- Run lighthouse audits on mobile and desktop
- Record current conversion rates and bounce rates by page
Day 2: Identify Your Biggest Opportunities (6 hours)
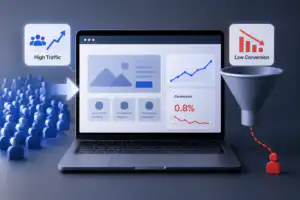
Hours 1-2: Find Your Money Pages
- Identify pages with highest traffic but lowest conversion rates
- These are your prime optimization targets
Hours 3-4: Diagnostic Deep Dive
- Use Chrome DevTools Performance panel to identify long tasks
- Analyze TTFB across different geographic regions
- Check error rates in your server logs
Hours 5-6: Competitive Intelligence
- Audit your top 3 competitors using these same metrics
- Identify where you’re winning and where you’re losing
The $100K+ Quick Wins (Implement This Week)
Monday: Image Optimization Blitz
- Compress all images above 100KB
- Convert to WebP format
- Implement lazy loading for below-fold images
- Expected impact: 15-30% improvement in Speed Index
Tuesday: JavaScript Diet
- Remove unused JavaScript (use Chrome Coverage tab)
- Defer non-critical scripts
- Split large JavaScript bundles
- Expected impact: 20-40% improvement in TBT and TTI
Wednesday: Server Upgrade
- Switch to premium DNS provider
- Implement Redis caching
- Optimize database queries causing slow TTFB
- Expected impact: 40-60% improvement in TTFB
Thursday: Error Elimination
- Fix all 404 errors on high-traffic pages
- Implement proper error handling for forms
- Set up monitoring alerts for error spikes
- Expected impact: 2-5% conversion rate improvement
Friday: Monitoring Setup
- Configure alerts for performance regressions
- Set up weekly performance reports
- Create dashboard for stakeholder visibility
Expected impact: Prevent future performance disasters
The Performance Profit Calculator
Use this formula to estimate your revenue impact:
Annual Revenue Loss = (Current Conversion Rate × Traffic × Average Order Value) × Performance Impact Factor
Performance Impact Factors:
- TTFB > 1 second: 0.15 (15% revenue loss)
- TBT > 2 seconds: 0.22 (22% revenue loss)
- Error rate > 1%: 0.31 (31% revenue loss)
- TTI > 5 seconds: 0.28 (28% revenue loss)
Example:
- Site traffic: 100,000 monthly visitors
- Conversion rate: 2%
- Average order value: $75
- Current TTFB: 1.8 seconds (15% revenue loss)
Monthly revenue loss: (2% × 100,000 × $75) × 0.15 = $22,500Annual revenue loss:$270,000
Stop Losing Money to Performance Problems
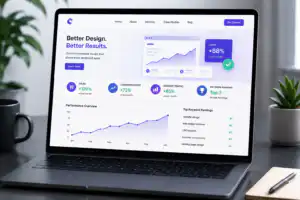
Every day you delay optimization costs you real revenue. While your competitors chase Google’s metrics, you can dominate by tracking what actually drives conversions.
The companies winning in 2025 aren’t the ones with perfect Core Web Vitals—they’re the ones monitoring the metrics that predict customer behavior.
Start your performance audit today. Your revenue depends on it.
Ready to uncover your hidden revenue leaks? Run a free performance audit using the checklist above, or hire our team to identify your biggest opportunities in 48 hours. Every week you wait costs you thousands in lost conversions.