


|
Core Web Vitals optimization means getting your site fast for real visitors rather than for a speed test. Google grades three things: how fast your main content appears, how quickly the page reacts to a tap, and whether the layout shifts while loading. It measures the experience of real Chrome users over 28 days. |
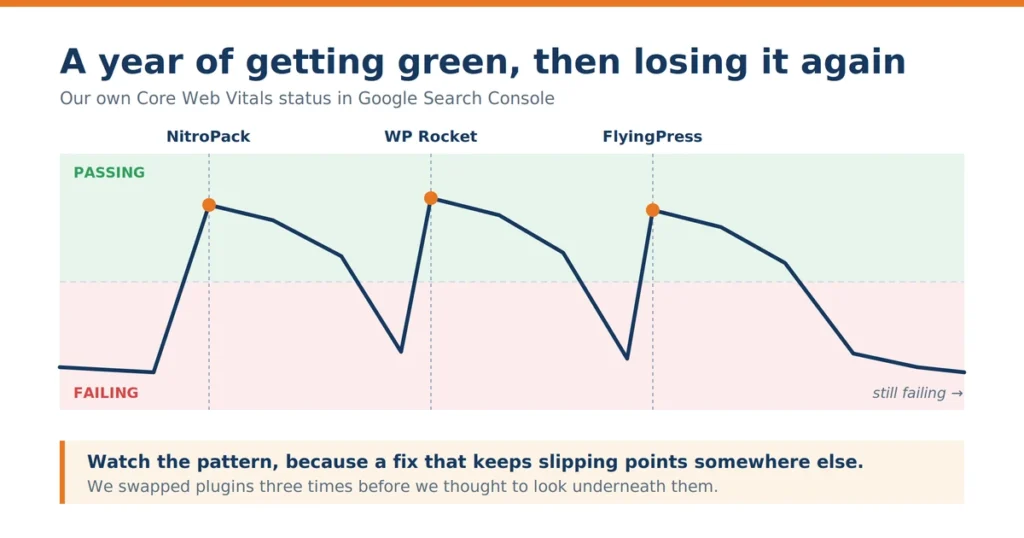
For about a year, we at WisdmLabs, struggled with this on our own site. In our case, Our Core Web Vitals status in Google Search Console kept yo-yoing between yellow and green. And keeping it green was the biggest problem.
It would go green and hold for a few weeks. Long enough that we’d stop checking. Then something would knock it over, and we’d be back to work. Then it would hold again, and we’d relax again, and it would break again. And this vicious loop of passing and not passing went on for a year…
That’s an uncomfortable thing for a company to publish. But we think the failures are the useful part, because most of what’s written about how to improve Core Web Vitals skips straight to the fixes. Curious to know what happens when the fixes stop working? Read on!
By the way, all 330 of our monitored URLs now pass in Google Search Console. Here’s everything that went wrong first.
What Core Web Vitals actually measure (and one thing most get wrong)
Three numbers decide whether you pass.
Largest Contentful Paint (LCP) is how long until your main content appears. Google wants under 2.5 seconds.
Interaction to Next Paint (INP) is how quickly your site responds when someone clicks or taps. Under 200 milliseconds (INP now replaces FID)
Cumulative Layout Shift (CLS) is whether things jump around while the page loads.
What most people still get wrong is that they focus on First Input Delay, or FID. Google retired that metric in March 2024 and replaced it with INP. If you’re reading advice that still mentions FID, it predates the change and you should treat the rest of it carefully too.
Now, the number that matters isn’t the one your speed test gives you. Google judges you on field data, which comes from real Chrome users visiting your site. Your PageSpeed Insights score is lab data or a simulation. And the two disagree constantly.

This was one of our own pages: The 80 in the circle is a weighted average of things Google does not rank you on. The 3.8 seconds next to it is one of the three that it does.
Most people glance at the score in the circle and move on. But we spent the year in what that number leaves out.
|
Also read: Beyond Core Web Vitals: the performance metrics that actually matter The three metrics mentioned above (LCP, INP & CLS) are what Google primarily grades or evaluates. But remember, they are not the only numbers worth watching. |
The plugin carousel: three caching plugins, three different failures
We tried three. Each one solved something and broke something else.
If you’re wondering whether a caching plugin will fix your Core Web Vitals, this section is the honest answer. Sometimes, it depends entirely on what’s underneath.
Quick check before you read further. Two things made our site unusual. We publish a lot, most weeks something changes. And several people do it, marketing, content and design, often on the same day.
If your site changes once a month and one person handles it, you’ll skip most of what follows. If it changes daily and a few people have access, keep reading.
Let’s begin with our first choice, NitroPack.
Our Experience with NitroPack
The reason we picked NitroPack was because we believed it was a simple one-click install that would be easier to maintain.
Also NitroPack produced beautiful synthetic scores. It got them by holding JavaScript back until a visitor actually interacted with the page.
Then real people clicked things. Our WooCommerce product enquiry forms and custom product box selectors all ran their delayed scripts at once, and INP spiked past 500 milliseconds. The test was passing while our visitors waited.
We’re not the only ones who found this. The team at WP SpeedFix has written that any service guaranteeing a perfect score is only partly loading your site, and that delaying JavaScript looks great in a speed test while genuinely slowing things down for the person using it.
So here’s what to check on your own site. Does anyone click anything on it? A booking form, a filter, an enquiry box, a course player. If yes, a tool that delays JavaScript will make your score look good, and those clicks feel slower.
|
Try this yourself: Open your busiest page on an average phone, tap the thing people tap, and count. If the score says green and the tap feels slow, the tap is right. That’s how you find out if your score is lying. Ours was. And for us the deeper problem wasn’t even the scoring. It was “publishing” – something we hadn’t thought about at all: “what happened every time one of us hit publish” . |
The loop we couldn’t get out of
Our site was built years ago on a shared Global CSS file. One central stylesheet enforcing a consistent look across every custom plugin we’d written.
Over time, whenever a page needed a small design tweak, a developer added a rule to that central file. Reasonable at the time. Thousands of small decisions later, everything on the site depended on one stylesheet.
So editing any single page changed the global CSS, and NitroPack treated that as a site-wide change and cleared the cache for every page.
Rebuilding a full cache took up to 6 hours. And our marketing and content teams were making 6 to 8 edits a day.
Read those two numbers together. The cache was being wiped several times before it could ever finish rebuilding. Our scores in isolated tests were excellent. In practice, almost nobody was ever served a cached page.
Now there is one thing to clarify. Nobody did anything wrong here.
The stylesheet made sense when it was built. Publishing often is good. Letting a few people update the site is how a small team gets anything done. Every one of those was a fair call on its own. Together they gave us a site that was never really cached.
That’s why this catches growing businesses and leaves small ones alone. Fifty pages edited once a month is fine. The same setup with a team publishing daily is not. And you are never notified when you’ve crossed over.
|
You can test this yourself in ten minutes. This one needs someone technical, and it’s worth twenty minutes of their time. Most edits won’t do it. Change some text, swap an image, and a decent caching setup clears just that page. What clears everything is a change that touches your shared stylesheet, the CSS that every page on your site loads. That’s the part people don’t see coming. On a page builder, a small design tweak on one page can write to that shared file. The team misses it, and the publish button looks the same either way. So ask your developer two questions. Does our design work write to a global stylesheet? And when it does, does the cache clear for that page or for all of them? The answer also depends on what you are running. A caching plugin can often clear just the page that changed. A hosted service like NitroPack treats a global stylesheet change as a site-wide change and clears everything. If the answer is all of them, get the rebuild time and compare it to how often your team publishes. If the edits come faster than the rebuild, you’re never really cached. A better plugin won’t change that. |

So NitroPack came off. The one-click install we picked for its simplicity turned out to be the reason we had no control over any of this. We couldn’t tell it to treat a stylesheet change as anything other than a site-wide event.
Moving on to WP Rocket: It gave us a blank screen for three seconds
After NitroPack, we wanted more control. WP Rocket gave us that, and a lot more setup with it.
To pass benchmarks with WP Rocket on a site built in Elementor, we had to turn on full CSS and JavaScript minification and bundling. That was mandatory.
Elementor builds hero banners using inline CSS background-image properties. Once we bundled and compressed the stylesheets, the browser’s preload scanner couldn’t find those banner images early enough to prioritize them.
The result was strange. The page stayed completely blank for 2 to 3 seconds, then rendered all at once.
To a human tester, that pop-in felt fast. Google’s LCP timer measured the whole wait, and we failed 2.5 seconds every time.
Generating Critical CSS didn’t fix it, because render-blocking scripts in Elementor’s queue kept holding up the main browser thread no matter what we did with the CSS.
Then there were the mystery cache purges. Our whole site’s cache kept clearing for no visible reason. We genuinely suspected someone on the team was doing it manually. It turned out that editing or publishing a single page triggered an automatic full-domain purge through WordPress cron.
This isn’t unique to WP Rocket, incidentally. Cloudflare’s own WordPress plugin documentation describes the same behavior: editing a post fires hooks that purge the associated cached URLs.
Early-tier support couldn’t help us work out what was happening. We eventually got a direct conversation with a senior support engineer from WP Rocket at WordCamp Mumbai 2026 WordCamp Mumbai 2026, and our engineering team came up with a custom script to restrict those automated cron purges.
Here’s the version of this that matters for you.
On a fast-scaling site, more than two or three people can publish, and none of them can see the whole picture.
Because your developers aren’t watching the content calendar. Whoever writes the copy has no reason to think a text change touched the cache. Everyone sees their own edits and nobody sees the pattern.
So when the site becomes slow, the search starts with who. Who cleared it, who published something heavy, who changed a setting.
Unfortunately, you will always end up on a dead end with this search. Meanwhile, the site stays slow, and you’ve already lost weeks looking.
So, ask a different question. Not who did it, but what your publishing process sets off automatically, every single time, no matter who hits the button.
Get someone technical to trace one ordinary edit end to end and tell you what it triggers. On a high scaling website, an hour of this exercise will teach you more than a month of asking around.
We got the cron purges under control in the end. What we couldn’t fix was the blank screen. Because that came from how the pages were built rather than from how they were cached. So we tried one more and it was FlyingPress.
|
Also read: Async, defer and module loading: how to stop JavaScript blocking your pages If render-blocking scripts are your problem too, this article covers the loading strategies that help |
The next step: Unfortunately, FlyingPress was leaking full-size images
By the third plugin we knew what to test for. FlyingPress had the same render-blocking problems on our DOM-heavy Elementor pages. But it also had a subtler issue that took us a while to spot.
FlyingPress does its image work at the moment of upload. You add an image through the WordPress Media Gallery, it gets compressed and converted to WebP on the way in. Clean, automatic, no thinking required.
So we turned it on and expected our image problem to go away.
It did, for new images. Then we started opening old pages and found full-size files sitting there untouched, the same ones that had been there for years.
Here is what had happened. Our site has been around a long time, and over that time a lot of images went up the quick way: dragged straight onto the page inside the Elementor builder. Anyone who has scrolled through a media library with thousands of files in it knows exactly why. It is faster, and at the time there was no reason not to.
But dragging an image onto the canvas skips the Media Gallery entirely. And if FlyingPress never sees the upload, it never touches the file.
The plugin was working exactly as designed. It just had no way of reaching anything that was already there. Multi-megabyte images were live on real pages, and no setting was going to find them.
Which left us with two choices. Go through the site manually, track down every one of those images and re-upload it properly. Or stop chasing a fix that depended on how the file got there.
You almost certainly have a version of this. Not images necessarily, but something: a setting that only applies going forward, a fix that assumed everyone would follow or a process no team member wrote down.
It’s worse the longer you’ve been operating and the faster you’ve grown, because your site is carrying years of decisions made under different constraints by people who may not work there anymore. The tools you buy today work on what you do tomorrow. They rarely reach backwards into what you already built.
So when you’re evaluating anything, ask what it does about the pages you already have. A lot of tools fail that question.
We built our own fix for the visibility problem. FlyingPress had no dashboard for tracking cache flushes. So we at WisdmLabs worked with their engineering team and built an in-house telemetry dashboard to watch cache invalidation triggers in real time.
The part nobody warns you about: your CDN empties too
This one surprised us.
We were running Cloudways Edge Cache alongside Cloudflare. Watching TTFB latency in Cloudflare, we found that every site-wide application cache purge simultaneously purged the Cloudways Edge Cache.
That forced Cloudflare’s edge network to go back to our origin server for raw HTML. Load times degraded for everyone, including logged-out visitors on the simplest static pages.
So one content edit didn’t just clear one cache. It cleared three layers.
Also read:
Two more layers worth understanding before you add another one.
Redis vs Memcached for WordPress object caching
WordPress on HTTP/3: what it changes for performance
|
Quick Tip: So, ask whoever manages your hosting to write down every caching layer you’re currently paying for. That list is often the first surprise. Count your own layers before you go further. Most growing sites have more than the owner realizes. A caching plugin, a host-level cache, a CDN, sometimes an object cache underneath all of it. Each one got added by someone solving a real problem at the time, usually a different someone, often years apart. Nobody ever draws the stack. So nobody notices when one layer starts emptying the others, and you end up debugging a symptom three layers away from its cause. |
What we’d tell you before you buy another plugin
Every fix created a new problem. That’s the honest summary of that year.
A caching plugin can only compensate for what’s underneath it. It can’t fix it. If your architecture regenerates a global stylesheet every time someone edits a page, no plugin will keep you cached. The problem exists above the caching layer.
Ask these four questions before you buy:
- When a change is written to your global stylesheet, does the cache clear for that page or for the whole site?
- How long does a complete cache rebuild take?
- Does the plugin optimize images uploaded through your page builder, or only through the Media Library?
- Does an application-level purge also clear your CDN or host-level edge cache?
If you’re comparing options, we’ve written a fuller breakdown of speed optimization plugins and where each one fits.
Why our green scores meant nothing: the P75 problem
For months, we did what you are probably doing. We ran PageSpeed Insights across our page templates, saw green, and could not understand why Search Console disagreed.

This is what “green” looked like in the above image. A 96, four metrics passing, and an LCP of 2.6 seconds sitting just over Google’s 2.5 second line.
We assumed the site was fine as we were looking at all of it. Lab scores, field data in Search Console and traffic in Analytics. The numbers were on the screen but they were not adding up for some reason.
Now Google’s Chrome User Experience Report evaluates your whole domain at the 75th percentile, and it weights that average by traffic.
Here’s what that means in practice. You can optimize 90% of your pages perfectly. If those are low-traffic utility pages, it barely moves the needle. One slow page that gets a lot of visits, usually a homepage or your main mobile landing page, generates enough real-user data on its own to pull your entire domain out of compliance.
And we were fixing pages hardly anyone visited.
Remember, this gets worse, the faster you grow your business, and it’s the opposite of what people expect.
Traffic concentrates -> One landing page starts pulling most of your visitors because a campaign worked or something finally ranked -> That page ends up carrying your entire domain’s assessment by itself, and no report on your dashboard will tell you that.
|
Where to start, if you only do one thing! So, before you fix anything, open Search Console and Analytics side by side. Find the pages that are both slow and busy. That overlap is your whole job. Everything else can wait, and most of it can wait indefinitely. For a fast scaling business this is genuinely good news. It means the work is finite and you can scope it. You are not rebuilding your site. But you’re actually fixing a handful of pages that happen to matter more than the rest. |
This is a common enough problem that it shows up across platforms, rather just WordPress. In the Shopify community forums, store owners report suddenly failing the assessment after previously passing, with no obvious change on their end.
The tools we switched to
First things first, we stopped relying on synthetic testing. PageSpeed Insights and WebPageTest are useful, but they simulate. So, we moved to Cloudflare Observatory for real user monitoring and DebugBear for breaking down individual requests.
DebugBear let us split an LCP delay into four parts, which is what finally made the problem diagnosable:
|
Part of LCP |
What it actually is |
Usual culprit |
|
Time to First Byte |
How long your server takes to start responding |
Hosting, edge cache misses |
|
Resource Load Delay |
The gap between the page arriving and the browser fetching your main image |
Hidden CSS background-image rules, render-blocking JavaScript |
|
Resource Load Duration |
How long the image itself takes to download |
Uncompressed or oversized files |
|
Element Render Delay |
The wait between download finishing and the image appearing |
Main-thread JavaScript, font loading, layout recalculation |
If you want to set up your own monitoring, we’ve covered the free and paid tools for tracking WordPress performance separately.
One warning about speed tests generally. They can mislead you in more ways than the score. We’ve written about why load testing results often don’t reflect reality, and it’s worth reading before you trust any single number.
|
Also read: How to run a WordPress site audit – A wider check if speed turns out to be one of several things going on. |
Conclusion
So, better diagnostics told us what was actually broken on our site. They didn’t fix anything. And we still had a site failing on and off, with no version of “rebuild the whole thing” that could happen before the next quarter.
If you are a high scaling business, you’ll recognize the bind. The right fix is largely structural, and structural work takes months you can’t pause the business for. Therefore, you look for something that holds the line while you plan the real thing.
If you need support with speed-focused diagnostics on your website, you can explore our speed optimization service.
PS: Now…Part two of this guide picks up from here. We’ve written it up separately to cover things like:
– how to hold a passing score while you plan the real fix?
– what to look for when the real fix is your page builder?
– and what to lock down before your team grows again?
[Read part two: Core Web Vitals on WordPress, what actually fixed it →]


