


Yes. Page speed affects SEO. Google confirmed it as a ranking signal in 2021 and it still is.
That answer won’t get you anywhere, which is the problem with almost everything written on this question.
If you’re trying to get performance work funded, “Google says it matters” doesn’t survive contact with whoever controls the budget. They’ll ask how much, compared to what, and by when. This article answers those three.
The short version: your score isn’t what ranks you, one busy slow page can drag your whole domain down, and a problem you introduce today keeps costing you for a month before you can see it.
The three things that decide your assessment
“Google uses page speed as a ranking factor” is true, but on its own it doesn’t help much.
It doesn’t tell you which of your pages matter, how much fixing is enough, or when you’d know it had worked.
Those answers come from the mechanism, and there are three parts to this: field data, traffic weighting, and the 28-day window.
Part one: your speed test isn’t what Google is measuring
This is the most expensive misunderstanding in performance work, and it’s the reason a lot of budget gets spent on the wrong thing.
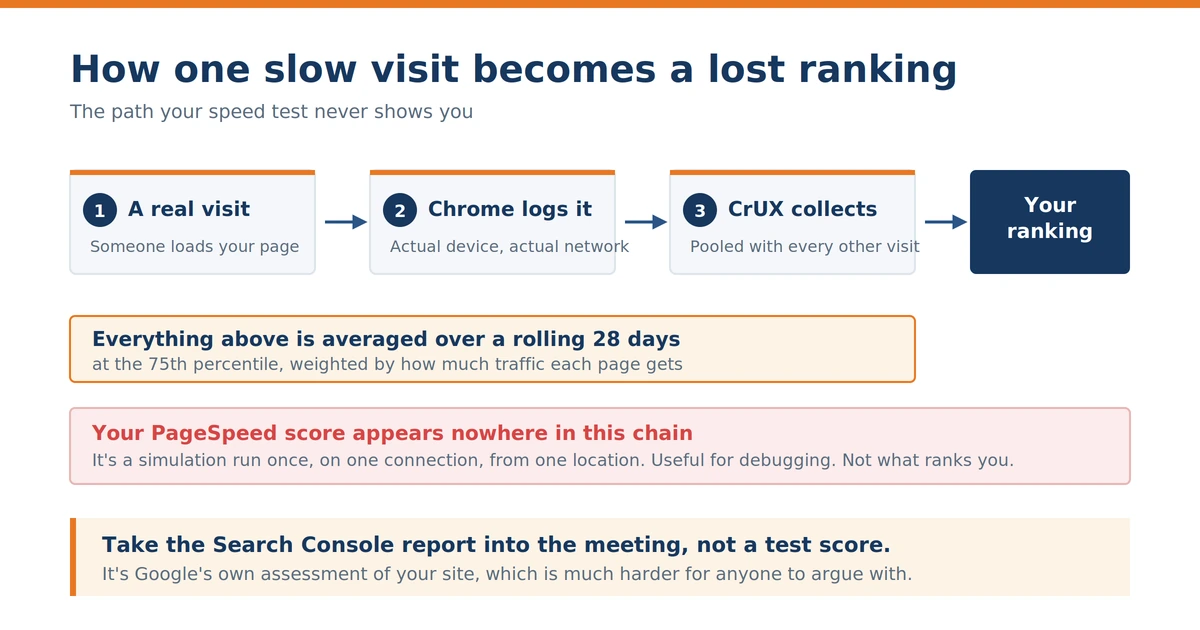
When you run a speed test you get lab data. A simulation, run once, on a controlled connection, from one location. Useful for debugging, and that’s about it.
What ranks you is field data: real measurements from actual visitors using Chrome, collected into the Chrome User Experience Report.
Those two numbers disagree constantly, and they can disagree in the direction that flatters you. A page can score green in testing while your visitors get something considerably worse on mid-range phones and ordinary connections.
Google’s own documentation on why lab and field data differ is direct about it. The lab environment isn’t the field.
If someone hands you a green test score as evidence that speed is handled, they’ve handed you a simulation. Ask for the Search Console field data instead.
Also read: Why your load testing results don’t reflect reality Speed tests can mislead you in more ways than the score. Worth reading before you trust any single number.
| What to pull before the meeting
Open Google Search Console, go to the Core Web Vitals report, and screenshot it. That’s Google’s own assessment of your site, which is much harder to argue with than a third-party tool. Export the list of failing URLs. You’ll need it for the next step, and it turns “our site is slow” into a specific, countable problem.If someone on the call brings a PageSpeed score, you now know what to say. It’s a simulation. The Search Console report is the scoreboard. |
Knowing your real numbers is the first half. The second half is working out which of them actually count.
Part two: one page can sink the whole domain
This is the finding that changes how you prioritize, and it’s why a lot of teams waste months.
Google evaluates performance at the 75th percentile of real user experiences, and that figure is weighted by traffic.
Say you optimize 90% of your pages to a high standard. If those are low-traffic utility pages, help articles, archives and old posts, they generate very little field data between them.
Now say one page gets most of your visits. A homepage, a main landing page, a category page. That single page produces enough real-user data on its own to pull the entire domain’s assessment out of compliance.
You can have a site that’s 90% optimized and still fail. We spent months in exactly that position on our own site, fixing pages almost nobody visited.
This gets worse the faster you grow, which catches people out. Traffic concentrates. One landing page starts pulling most of your visitors because a campaign worked or something finally ranked, and that page quietly becomes your whole assessment.

| How to find your overlap in twenty minutes
Open Search Console and Analytics side by side. Put your failing URLs next to your highest-traffic pages. Where those two lists overlap is your entire job. On most sites it’s two or three pages, not the whole site. That’s genuinely good news if you’re scoping a budget. You’re not rebuilding your site. You’re fixing a handful of pages that matter more than the rest, and that’s a number you can put in front of someone. |
So you know what’s failing and which pages count. The last piece is the one that decides your timeline.
Part three: the 28-day window is the real cost
This is the number to take into the budget meeting.
The field data Google uses runs on a rolling 28-day window. Nothing you fix today shows up in that data today.
Turn it around and it becomes your argument. A performance problem you introduce today keeps costing you for a month before recovery registers anywhere you can see it.
A plugin update that slows your main landing page on the first of the month is still being measured on the twenty-eighth. You won’t see it in Search Console until the window has absorbed it, and you won’t see the recovery until a new window has absorbed the fix.
That’s what makes this a standing operational risk instead of a technical task. It’s also why performance suits continuous monitoring far better than a one-off project.
| What people assume | What actually happens |
| We’ll fix it and see results next week | The rolling window means at least 28 days before the fix shows up |
| A green test score means we’re passing | Test scores are lab data. Field data from real visitors is what ranks you |
| We need to optimize the whole site | Your highest-traffic pages carry most of the weight in the assessment |
| If something breaks we’ll notice quickly | You’ll notice when the window catches up, up to a month later |
Also read: A guide to monitoring performance over time If the 28-day lag is the problem, continuous monitoring is the answer. This covers the free and paid options.
Not sure how bad your 28-day exposure actually is?
Run your site through the analyzer, then compare it against your Search Console report. If the two disagree, you’ve got a month of unmeasured risk sitting on your busiest pages right now.
[ See the Gap for Yourself ] https://wisdmlabs.com/site-speed-analyzer/
How much does page speed actually affect rankings?
Less than the people selling speed work imply, and more than the people dismissing it admit. Both camps overstate their case.
Core Web Vitals sit inside Google’s page experience signals. They work as a tiebreaker, not a trump card, so a fast page about the wrong thing won’t outrank a slow page that answers the question properly.
Speed is rarely why a page ranks first. It’s frequently why a page doesn’t.
The published evidence is strongest on what happens after a fix. Google maintains a set of case studies with named companies and measured outcomes.
The ranking and traffic evidence
Nykaa found that a 40% improvement in Largest Contentful Paint led to 28% more organic traffic from tier two and tier three cities, according to Google’s business impact case studies.
Redbus cut Cumulative Layout Shift from 1.65 to zero and reported significant domain ranking uplift across their global markets, including a 192% uplift in one. Their Core Web Vitals work also contributed to an 80 to 100% increase in mobile conversion rates.
Those two matter more than the conversion statistics that usually get quoted, because they measure the thing this article is about. Search visibility.
The controlled evidence
The cleanest study is Rakuten 24, published on web.dev. They ran a month-long A/B test where the only difference between the two versions was Core Web Vitals optimization. No functional changes, no visual changes.
The optimized version produced a 53.37% increase in revenue per visitor, a 33.13% increase in conversion rate, and a 35.12% reduction in exit rate.
Because it was a controlled test with one variable, that’s causal evidence. Most speed statistics you’ll see quoted are correlational, including several in the same case study.
| Company | Change made | Measured outcome |
| Nykaa | 40% LCP improvement | 28% more organic traffic from tier 2 and 3 cities |
| Redbus | CLS reduced from 1.65 to 0 | Significant domain ranking uplift, 192% in one market |
| Vodafone Italy | 31% LCP improvement | 8% more sales, measured by server-side A/B test |
| Rakuten 24 | CWV optimization, A/B tested | 53.37% revenue per visitor, 33.13% conversion rate |
| Agrofy | 70% LCP improvement | 76% reduction in load abandonment (correlation) |
One caveat to carry into any meeting where you use these. They’re large, well-resourced companies with high traffic. The direction is reliable. The magnitude isn’t a forecast for your site, and claiming otherwise is how people lose credibility on the second ask.
Also read: Beyond Core Web Vitals: the metrics that actually matter Google grades three numbers. They aren’t the only ones worth watching once you start measuring.
All of which is the search case. On most platforms it’s not even the expensive part.
It’s not only about rankings
The SEO framing is how this question usually gets asked, and it undersells the case badly.
On a platform where people do more than browse, slowness shows up in your operations long before it shows up in search.
Maximo Nivel runs English language education across Costa Rica, Guatemala, Peru and the United States, teaching through an online learning platform. Heavy server usage was slowing pages for everyone using it. The work we did with them produced a 30% improvement in page load speed, alongside 50% faster course completion and 99% scheduling accuracy.
No rankings report tracks course completion. That’s the number the business actually runs on.
That pattern holds anywhere your website is doing work instead of displaying information. Learner progress, booking flows, member portals, internal dashboards, support queues. Slowness taxes all of it, and none of it shows up in a rankings report.
We’ve seen the same shape on a different kind of platform in our eLearning speed optimization case study.
| What slow actually costs, by what your platform does
Courses and learning platforms: most of your real usage sits behind a login, and logged-in traffic normally bypasses page caching entirely. So, your marketing pages can be fast while the lesson experience your learners pay for is slow. Measure a lesson page while logged in. Then look at completion and drop-off rates by week, because that’s where the cost lands.EdTech and SaaS platforms: your cost shows up in trial-to-paid conversion and in support volume. Slow onboarding screens generate tickets that look like confusion but are actually latency. Check the load time of your first-run flow against your activation rate.Stores: cart, checkout and account pages are excluded from caching for the same reason. Product grids are interaction-heavy, so INP usually fails before LCP does. Test a filtered category page on a mid-range phone and count the wait after a tap. The common thread: find the pages your cache can’t touch and measure those. That’s where slowness is doing full-price damage, and it’s almost never the page you’d test first. So, when you build the internal argument, the search case is your opening. The operational case is usually what lands with someone who doesn’t think about SEO at all. |
If you run a store, start here instead
Everything above applies to you, but the conversion economics of an online store are a separate and well-covered conversation, and repeating it here wouldn’t add anything.
We’ve written that one in full. Our WooCommerce speed optimization FAQ guide covers the conversion side, checkout speed and the store-specific numbers. Come back to the three mechanisms above for the search side.
Building the internal case
If you’re the person who has to ask for this, here’s the argument in the order that tends to work.
1. Lead with the field data. Pull the Core Web Vitals report from Google Search Console. It’s Google’s own assessment of your site, which is much harder to argue with than a tool anyone can dispute.
2. Name the pages. Show the overlap between your slowest pages and your highest-traffic pages. This makes the work finite and the cost estimable, which is what a budget holder needs.
3. Use the 28-day window to set the timeline. It gives a realistic expectation for when results appear, and it explains why monitoring has to continue after the project ends.
4. Include the operational cost. If your platform carries workflows, quantify what slowness does to those. That number is usually larger and always more concrete than a ranking estimate.
5. Be honest that speed is a tiebreaker. Overclaiming gets you the budget once and loses you credibility permanently.

A few things people ask us when this comes up.
Frequently asked questions
Is page speed a direct ranking factor?
Yes, as part of Google’s page experience signals, confirmed publicly in 2021. It works as a tiebreaker between pages of comparable relevance rather than as a primary ranking driver. Relevance still decides most outcomes.
How long before speed improvements affect my rankings?
At least 28 days, because Google’s field data runs on a rolling 28-day window. The technical work can be finished in days. The measurement is the slow part, and the same delay applies in reverse when something breaks.
Why does my site pass speed tests but fail in Search Console?
Speed tests give you lab data from a simulated environment. Search Console reports field data from real visitors on real devices and connections. A green test with a failing assessment usually means your test conditions are kinder than your visitors’ actual conditions.
Do I need every page to pass?
No. Google assesses your domain at the 75th percentile, weighted by traffic. Your busiest pages carry most of the weight. Fixing the overlap between slow and high-traffic usually moves the domain assessment on its own.
Is it worth fixing speed if my content isn’t ranking anyway?
Fix relevance first. Speed won’t rescue content that doesn’t answer the query. Where speed earns its keep is on pages that already rank and are competing against similar alternatives, and on platforms where slowness costs you operationally regardless of search.
My budget holder wants a revenue number. What do I give them?
Don’t extrapolate from the case studies in this article. Use your own data instead: take the conversion or completion rate on your slowest high-traffic page, compare it against a comparable fast page, and present the gap. It’s a smaller number than the headline statistics and far more defensible.
Where to start
Start with what your real visitors are actually getting, and which of your pages carry enough traffic to matter. Buying a plugin or asking for a quote comes later, if at all.
Want to know where your site actually stands before you ask anyone for a budget?
Our free analyzer gives you a read on your real-visitor numbers in about a minute. No signup, no sales call, and you can take the output straight into the meeting.
After running the Site Speed Analyzer on your website, for a starting read, open Search Console, go to the Core Web Vitals report. And note which URLs are marked Needs Improvement or Poor. This is your master list and a great starting point when it comes to fixing your speed-related issues.
If the answer turns out to be structural instead of a settings fix, we’ve written up what that looked like on our own site in part one of our Core Web Vitals guide and part two, which covers what actually worked. If you suspect your page builder is the source, that’s a separate diagnosis with three checks you can run yourself. [PUBLISH NOTE: unlink until Article 2 is live.]
And when you get to the point of wanting someone to look at the infrastructure properly instead of selling you a plugin, that’s what our website speed and scale optimization work is for.