


| You’ve landed on part two of our Core Web Vitals guide.
If you know what’s slowing your site but not what to do about it, keep reading. If you’re still working out the cause, part one covers the diagnosis. [Read part one →] |
If your site passes Core Web Vitals one month and fails the next, the problem usually isn’t the thing you fixed last time. It’s something underneath, that resets every time you publish.
That was us for about a year. And part one covers how we found it.
Every time somebody published a page, our whole cache cleared, and a full rebuild took six hours. We were editing six to eight times a day, so the site was almost never actually cached. Test scores looked fine. Real visitor data didn’t.
This is the practical second half.
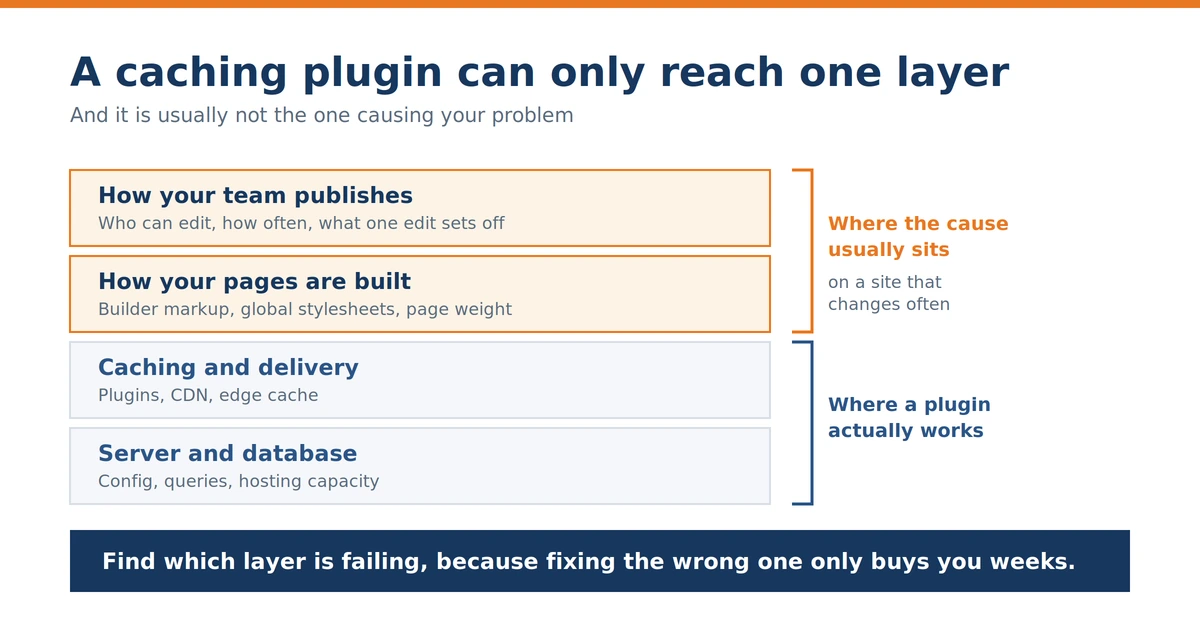
You can read the first part here [Link to part 1/piece 1]. But if you’re pressed for time, one thing worth carrying in is that, if a caching plugin isn’t fixing your scores, it’s probably because the problem is above the caching layer, where no plugin can reach.
This article will help you understand what to do about that.
So, What finally got us to green??
On 4 May we deployed the first iteration of Airlift.
By 16 May the trend was clear, and Google Search Console validated our entire origin as Good. 62 benchmark pages averaged 2.4 seconds LCP and 118 milliseconds INP. All 330 URLs cleared the validation loop.
One disclosure worth making: Airlift is a commercial product from BlogVault. We’re describing what worked for us, not recommending a purchase.
It didn’t go smoothly.
Airlift works by aggressively accelerating a curated whitelist of high-priority pages. Live monitoring showed us a flaw within days. On pages outside that whitelist, the automated algorithm was misreading top-of-page hero banners as secondary content and lazy-loading them. LCP fell off a cliff on those pages.
A midnight patch pushed Critical CSS generation to every unlisted page and resolved it. We kept a 14-day watchlist running afterwards.
The lesson is about the category, not the product. A SaaS optimization engine is a bridge, not a destination. It gets you to green while you fix the real problem, and it needs live telemetry watching it, because it will make automated decisions about your pages that you didn’t ask for.
There is nothing wrong with buying time. Sometimes it’s the correct call, especially if rankings are already slipping and a rebuild is two quarters away. Just be honest with yourself about which one you’re doing.
The trap for a fast-growing business is that the bridge works well enough that the rebuild never gets scheduled. A bridge you never walk across is just a subscription. If you go this route, put a date on the structural work before you sign anything.
| Also read: LiteSpeed Cache: the full settings walkthroughIf you’d rather hold the line with something you configure yourself instead of a hosted service, this walks through one option setting by setting. |
Want to see where your own site currently stands? Our free site speed analyzer gives you a starting read in about a minute.
Now Airlift kept us green. However, what it couldn’t tell us was why staying green took this much work.
The real problem was our page builder
Everything above was us managing symptoms.
Which is fine for a while, and then it isn’t!
The question we should have asked much earlier: why does this site need so much help to stay fast?
If you’re layering tools to hold a passing score, it’s worth asking why. . It usually means the site was built for a business smaller and slower than the one you’re running now. And It’s just what outgrowing something looks like.
The root cause was structural. Elementor wraps basic text and images inside several nested container layers, section inside column inside widget-wrap inside widget. That inflates the size of your page’s DOM tree, and a bigger DOM means heavier layout recalculation on every interaction.
A single image on our site sat inside four containers.
This isn’t a small effect. According to Google’s own guidance on DOM size, Lighthouse starts warning you when a page body exceeds roughly 800 elements, and reports an error above roughly 1,400. Wrapper nesting is what pushes an ordinary page across those lines.
Rebuilding in native Gutenberg cut our DOM depth by more than 60%.
Gutenberg also loads assets only on pages where that specific block exists, rather than loading large JavaScript and CSS libraries across the whole site. That’s what resolved our global CSS problem at the source.
Staging benchmarks confirmed the part that mattered most: once Elementor was out, ordinary server caching held green metrics across the domain without any complex SaaS layer on top.
We’ll be covering the role of various page builders on core web vitals, including what this means if you’re on Divi, Bricks, WPBakery or Beaver Builder rather than Elementor.
| Also read: When to move beyond WordPress customization templates – Your builder adds code to every page. So does your theme. On a lot of sites, the theme is the heavier of the two, so check both before you decide the builder is at fault. |
| In the meantime, these are the three key things to check on your own build:
1. Count the DOM elements on your heaviest page. Over 800 is a warning, over 1,400 is a problem. Any one of those coming back badly means your tooling isn’t your problem. |
Don’t rebuild if you publish monthly, run a few templates, and your cache survives an edit. Turn on your builder’s own performance settings on a staging copy and see what that gets you first.
Either way, get a number first. Ask a developer what a rebuild would take on your site. Put that against what you’re already paying for tools that treat the symptom.
Not sure if your page builder is slowing your scaling site down?
We help you check your theme, plugins and database load against the actual numbers. And you find out whether the speed problem is the builder or something cheaper to fix.
Where each layer actually landed
| Layer | LCP behaviour | Real INP | Cache in practice | Edge / TTFB | Removes the bloat? |
| NitroPack | High synthetic score | Poor, over 500ms | Effectively uncached | Severe edge purges | No, masks the DOM |
| WP Rocket | Pop-in, over 2.5s | Moderate | Unstable, cron purges | TTFB spikes on purges | No, basic delivery |
| FlyingPress | Moderate to high | Good | Stable, custom tracking | Moderate | Low, leaks builder uploads |
| Airlift (current) | Very high, 2.4s avg | Very good, 118ms avg | Optimized, whitelist | Stable TTFB | Moderate, SaaS engine |
| Native Gutenberg (goal) | Optimal | Optimal, minimal JS | Native caching support | Zero purge spikes | Maximum, zero bloat |
Read the last column in the table above (“Removes the bloat”). Four of those five kept our score up without changing anything below it. Only the last dealt with the cause.
That’s not an argument against tools. We used them, they helped, and we’d use them again in the same situation. It’s an argument for knowing which column you’re buying, especially when your brand is growing and the temptation is always to buy the fast one.
So, the technical side was sorted, meaning the rebuild worked. The part we hadn’t thought about was keeping it that way once people started publishing again.
Core Web Vitals optimization is a team sport, rather than a plugin purchase
This is the part we got most wrong, for the longest.
Core Web Vitals is not a tech team problem. Installing a plugin doesn’t solve it. Staying compliant meant real operational compromises from three teams that had never thought of performance as their job.
Content: Copy and media have to stay tight. Every extra element adds DOM weight, payload size and page height. That’s a constraint on how people write, and it had to be agreed rather than imposed.
Design: Designers now reuse standard modular templates instead of creating one-off visual variations. Every bespoke layout means custom JavaScript and CSS, and every one of those has a cost that shows up months later.
Engineering: Field metrics get monitored continuously, not checked after a complaint. Google’s CrUX data runs on a rolling 28-day window. An undetected problem today costs you a full month of rankings before any recovery shows up in Search Console.
Guardrails: Plugin updates, design changes and content overhauls all happen in staging now, with automated performance checks in CI/CD. Direct editing access to live production is restricted to a small number of technical gatekeepers.
That last one was unpopular. It’s also the single change that stopped regressions.
If you’re scaling, this is the part that will bite you before any of the technical work does.
Every new hire gets access. Every one of those grants is reasonable at the time. Nobody plans for the day when six people can change a live page and none of them know what a DOM node is.
And they shouldn’t have to. That’s the point.
Because this isn’t about people being careless. It’s about what the setup allows. Put changes through staging, add a check that runs before they go live, and keep the list of people who can publish to production short.
If you’re adding people faster than you’re adding processes, do this one first. It’s cheaper than everything else in this article and it prevents more damage.
| Start here this week:
None of this needs a developer, and you could do all three this week. Pull up the list of everyone who can publish to your live site. It’s usually longer than anyone expects, and most of those people are fine with draft access. Next, put one name against the Core Web Vitals report in Search Console so somebody notices when it slips. Then settle one rule with design and content and write it down. Ours was that new pages use existing templates unless there’s a reason not to, and that single line did more than any tool we bought. |

How to improve Core Web Vitals: a checklist you can actually run
So here are the steps you can follow if you were to start again. Work through these in order. Some make a mistake of starting at step four and end up getting stuck. Let’s go!
Diagnose before you buy anything:
● Open Google Search Console and look at the Core Web Vitals report, not PageSpeed Insights. That’s field data.
● Cross-reference failing pages against your actual traffic. Fix the busy ones first.
● Check whether a single page edit clears your entire site cache. If it does, stop and fix that before buying a plugin.
● Time a full cache rebuild. Compare it to how often your team edits.
Check the structure:
● Count the DOM elements on your heaviest page. Over 800 is a warning sign, over 1,400 is a problem.
| You can check this yourself on your homepage and your busiest landing page. It takes 30 seconds.
Open the page in Chrome, right-click, choose Inspect, then click Console and paste in document.getElementsByTagName(‘*’).length and hit enter. The number that comes back is your answer. |
● Check whether images uploaded through your page builder get optimized, or only Media Library uploads.
● Confirm whether an application cache purge also empties your CDN or host edge cache.
| Also read: 12 ways to improve mobile speed on WooCommerce – If you run a store, mobile is where these numbers fail first. Google grades mobile and desktop separately, and mobile is usually the one dragging the assessment. |
Set up the monitoring:
● Use a real user monitoring tool, not only synthetic tests.
● Break LCP into its four parts so you know which one you’re fixing.
● Give someone explicit ownership of field metrics. Not “the tech team”. A person.
Agree on the rules:
● Decide what content and design can and can’t do, and write it down.
● Move changes to staging with automated performance checks.
● Restrict production editing access.
| The short version:
Your score isn’t your ranking. Real-user data over 28 days is. Your busiest pages carry the assessment. Fix those, ignore the rest for now. If one edit clears your whole cache, no plugin will save you. Speed holds when the process holds. It’s an operations problem, not a purchase. |
Frequently asked questions
Why does my site pass PageSpeed Insights but fail in the Search Console?
Because they measure different things. PageSpeed Insights gives you lab data, a simulation run in controlled conditions. Search Console reports field data from real Chrome users over a rolling 28-day window. A green lab score with a failing field assessment usually means your test conditions are kinder than your visitors’ actual devices and connections.
How long does Core Web Vitals optimization take to show results?
Expect at least 28 days before improvements appear in Search Console, because that’s the length of Google’s rolling data window. The technical work can be much faster. The measurement is what’s slow. This also means a regression you introduce today is costing you for a month before you see it.
Can a caching plugin fix Core Web Vitals on its own?
Sometimes, on a simpler site. On a site with a heavy page builder and frequent content edits, often not. A caching plugin compensates for what your site produces. If the underlying architecture invalidates the cache constantly or ships a very large DOM, the plugin never gets a chance to help.
Is Core Web Vitals still a Google ranking factor?
Yes. Core Web Vitals remain part of Google’s page experience signals. They matter most as a tiebreaker between pages of comparable relevance, so they’re rarely the reason a page ranks first, and often a reason a page doesn’t.
Do I need to fix every page on my site?
No, and trying to is how most teams waste months. Google evaluates your domain at the 75th percentile weighted by traffic. Your highest-traffic pages carry most of the weight. Fix those first and the domain assessment usually follows.
Where this leaves you
If your Core Web Vitals aren’t passing, the useful question isn’t which plugin to try next. It’s what your site does every time someone edits a page.
We spent a year learning that on our own site. The key takeaway was that the plugins weren’t failing, but they were being asked to do something the architecture made impossible.
If you take one thing from this, take this – The fact that your site used to be fast isn’t reassuring. It’s a symptom. High scaling sites like ours and yours don’t slow down because someone made a bad decision. They slow down because a set of good decisions stopped fitting the way the business works now.
Growing is what breaks it. Which is a strange thing to have to plan for, but it’s cheaper than finding out the way we did.
If you want to see the pattern in a client project rather than ours, our eLearning speed optimization case study covers a similar diagnosis on a very different site.
And if you’re at the point where you’d rather someone looked at this properly than gave you another checklist, here’s how we at WisdmLabs work:
1. A 30-minute call. We work out what’s actually happening. No deck, no upsell.
2. A clear scope. What the work involves, how long it takes, what it costs. In plain language, before anything starts.
3. We do the work. You’re involved where your input matters, not dragged into every decision.
4. You review, we launch. Nothing goes live until you’re happy.
5. You own it. Everything is documented and handed over.