


To grow your LearnDash eLearning business, merely creating and selling courses won’t help.
The key to success is to have actual LMS data at hand at all times. Data that can help you easily take eLearning decisions.
And LearnDash ProPanel makes it possible. It neatly presents all important LMS data right in your dashboard.
ProPanel helps you gain additional insights into your courses and completion metrics. Plus, it lets you track your learner’s activities in real-time improving your admin experience.
Hence, to ensure the success of your eLearning venture, allow me to show you how to set up and use the LearnDash ProPanel function effectively.
So, without any further ado, let’s begin!
[lwptoc numeration=”none” title=”Setting up LearnDash ProPanel” toggle=”0″ skipHeadingLevel=”h3″ skipHeadingText=”*LearnDash ProPanel Alternative*|*Over to you,*”]
Step 1 – Install LearnDash ProPanel to manage activities easily
The very first step towards growing your LearnDash business involves installing ProPanel. Before starting, it’s important to note that ProPanel comes included with the LearnDash PLUS and PRO packages.
Important Note:
If you’re a LearnDash Cloud user, ProPanel comes already installed as part of your subscription.
If you use the LearnDash plugin, install ProPanel through the Plugins menu from the WordPress dashboard.
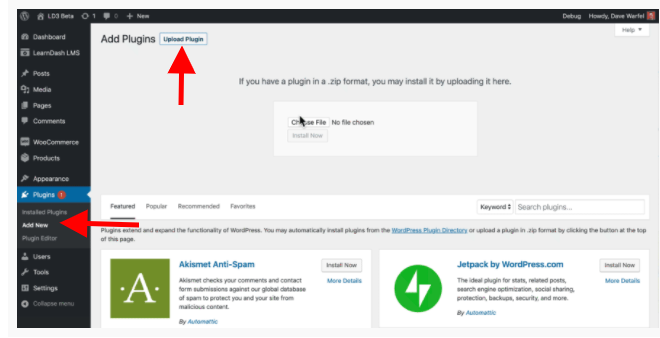
Now, to install ProPanel, follow the below steps:
- Go to Plugins > Add New > Upload Plugin
- Browse for the downloaded plugin, select the learndash-propanel.zip file
- Hit Install Now
- Click the Activate button
Important Note: To ensure uninterrupted and smooth functioning, remember to add your ProPanel license number in the plugin. You’ll get your license number upon purchase.
To add the License number, follow:
- LearnDash LMS > Settings > ProPanel License
Having done this, you’re now set to use the ProPanel functionalities. You can quickly hop onto your Dashboard to further manage activities.
LearnDash Dashboard Overview
Once you’ve installed ProPanel, it’ll appear directly in your backend Dashboard instead of a separate menu. You can check out its functionalities which are segregated into four reporting widgets in your dashboard:
- Overview Widget
- Activity Widget
- Reporting Widget
- Chart Widget
These widgets give in-depth information about different aspects of your LMS. Along with it, the ProPanel also gives you the freedom to hide/show these widgets at your convenience. You can use the Screen Options tab on the top right of your dashboard to hide a particular widget.
In doing so, you can avoid dashboard overcrowding and work distraction-free.
Group Leader Access
Moreover, you don’t have to worry about updating your Group Leaders with the data. ProPanel, by default, is visible to you and the Group Leaders.
The good part – it limits the Group Leaders to view activities and data of their group only. This ensures that your LMS data is safe and uncompromised.
[su_note]Recommended read: LearnDash Groups – Everything you need to know about them.[/su_note]
And, if you wish to extend the ProPanel visibility to other User Roles, you can do so with ease. All you have to do is- use the “propanel_widgets” shortcode along with a Role editing plugin.
Since these widgets reveal key information, let’s jump into how each widget can be best utilized to make important decisions.
Step 2 – Stay updated at all times with the LearnDash Overview Widget
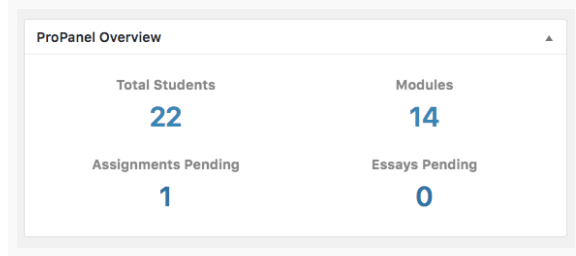
As the name suggests, the Overview widget provides you with a view for your entire LMS framework. It presents this with numbers and stats.
It displays top metrics like:
- Total no. of students
- No. of courses
- Pending assignments
- Pending essays
Each of the items in the overview widget is clickable links. For e.g: Clicking on Total Students will take you to the User administration dashboard. You or your group leaders can even approve/reject assignments or essays from here.
Plus, it saves you loads of time and effort of scrounging the entire LMS for these data.
Having said that, this overall LearnDash ProPanel view gives you a good idea about your current standings in line with your goals. It enables you to stay updated at all times. Plus, you can also work on developing actionable plans to correct the falling numbers.
You can use this overview widget to make informed decisions. But, there are more widgets that can further this value addition. Take a look……
Step 3 – Dive deep into your Users and Course data with Reporting Widget
This reporting function easily qualifies as the heart of your LMS!
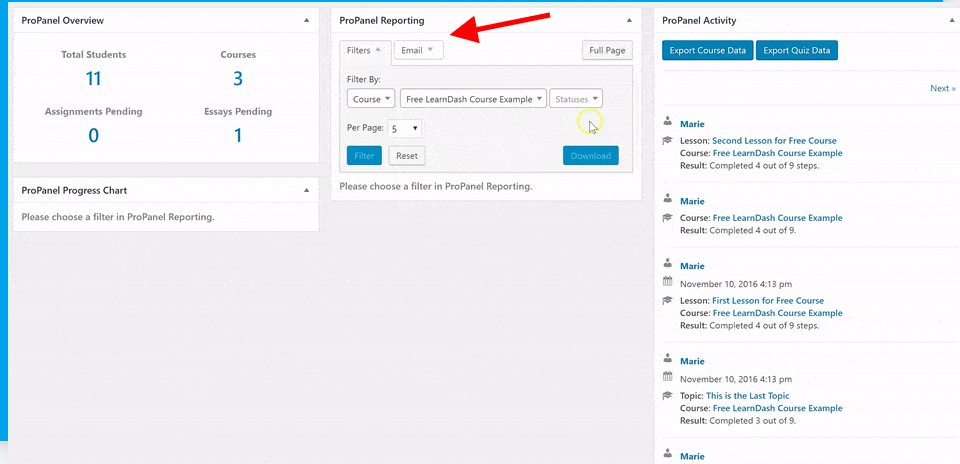
With this Widget, you can view your learners’ activities and their progress in a jiffy. You can choose to apply filters like ‘Users’ or ‘Course’ to dive deep into a specific learner’s activities.
The Full Page option
The ‘Full Page’ option allows you to view the report without distraction in a larger space. After applying the filter, the data output also reflects accordingly in the Activity and Chart Widgets.
The Emails Section
Apart from this, this widget also enables you to send emails to a selected group of learners.
For example: If you notice that learners haven’t completed a particular course, you can shoot an email directly from the box to intimidate them. You can send the email to a specific user or a group of learners. The choice is yours!
With this ‘filter’ option, it becomes easier for you to draw up relevant data in an instant using an ai photo editor for quick image enhancements. Once you have the data, you can download and export it to a CSV file as well.
Using this data allows you to judge the impact of your courses depending on your learners’ course progress rate.
And, the email option makes it quicker for you and your Instructors to identify the problems with the learner or the course. This, in turn, helps in speeding up the development and implementation of the corrective measures.
You can use this reporting widget to pull courses and user data and take apt decisions regarding any changes or actions.
On that note, let’s move on to the next function which is largely determined by the filter you select.
Step 4 – Chart Widget to view graphical User progress
The ProPanel Chart Widget is more or less the outcome of the previous point.
So, based on the filter you select in the Reporting widget, the Progress Chart dynamically displays the breakdown for Learner’s progress.
This progress is reflected in two charts:
- Course Progress Distribution chart
- In-Progress Breakdown chart
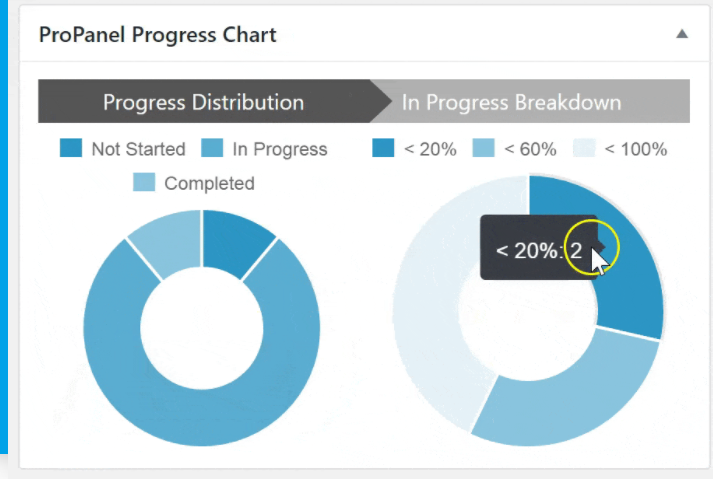
Course Progress Distribution Chart
As you can see from the above image, this chart shows the graphical statuses of the learners under the ‘Not Started’, ‘In Progress’, and ‘Completed’ courses category. To get the exact numbers, you can simply hover over the graph.
This provides a clear picture of your users’ interaction with your course. It also gives you an opportunity to spend some time designing fruitful ways of reducing the ‘Not Started’ and improving ‘In-Progress’ categories.
In-Progress Breakdown Chart
The second chart in the image gives you insights into users who are specifically under the course ‘In-Progress’ category.
As you hover over this chart, it reveals valuable and useful data about how far your learners have come in a particular course. With this function at hand, you can stay aware and alert at all times. Also, you can use the information wisely to push your learners to complete or move along in the course.
For e.g: If half of your learners have completed below 20% of the course, you can quickly take charge and shoot an email nudging them to get to 80% or finish the course.
With these graphical charts, you can easily determine the performance of a course and conduct an in-depth investigation into your learners’ interaction with the course. This can help you figure out techniques on how to make your course more engaging.
And, speaking of investigation, the final step in this process will make tracking learners’ activity seem like a walk in the park.
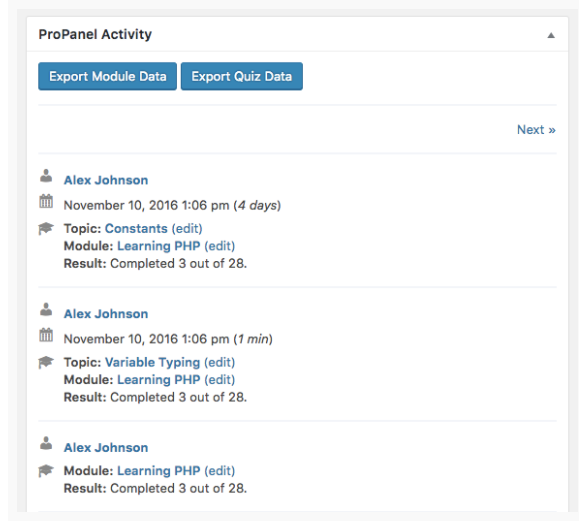
Step 5 – Monitor learners real-time data with Activity Widget
Now, this is an interesting reporting feature that will make you feel like Sherlock! :)
Once you click on this ‘Activity Tab’, it reveals the real-time activities of your learners’ interaction with your courses.
Whenever your learner marks a lesson complete, takes a quiz, finishes a course, or even when he/she signs up – everything is captured in the LearnDash ProPanel Activity stream. As if, recording footprints of each step your learner takes.
Again, depending upon the course you select in the Reporting function, this widget will accordingly display the latest activities for the selected course.
In a way, it reduces the bridge between offline and online classes. This activity stream enables you to formulate a more personalized approach to increase your learners’ real-time activity on your website.
In case, you’re curious to find out all the doings of a specific learner – simply select the learner and the activity widget will open up the learner’s history. In this way, you’ll always have a timeline of your learner’s progress.
To facilitate quick action, you can even place the Activity Widget on the front end by using the [ld_propanel_activity] shortcode.
Export Quiz Data
You also have the option to quickly export the LearnDash course and quiz data. However, when it comes to quiz reports, LearnDash, by default, offers a very basic report which may not make the export seem like a useful affair.
[su_note]Recommended read: Importance of Student Reports in Online Learning.[/su_note]
So, if you want to generate quiz reports with in-depth and valuable analysis, I recommend you to check out the WISDM Reports for LearnDash. It can turn out to be pretty useful for you and your Group Leaders.
When it comes to Group Leaders, the Activity Widget can be used by them as well. But, they can only view the activity of learners in their group. This restricts them from monitoring the learners’ activities in the other groups or courses.
Now, I know I said this function would reflect the final use of the LearnDash ProPanel. But, bear with me a little more as I uncover a small ProPanel secret :P
Step 6 – Display ProPanel on the front-end using Shortcodes
I’ve covered almost all functionalities of LearnDash ProPanel. To end this, I’ll quickly tell you how you can use ProPanel on the front end of your LearnDash website.
To implement ProPanel in the front-end, you can either:
- Use the [ld_propanel widget=”link”] shortcode on any page. You can also use the front-end template by adding /?ld_propanel to the URL. This is visible only to you and your Group Leader.
OR
- If you’re using Classic Editor, you can create your own template with ProPanel shortcodes. You can use it anywhere – on the main content page, posts, etc.
With that being said, you’re also empowered with the ability to change or customize ProPanel. All you need to do is override the existing templates.
To do this, you can access the plugin directory and find the /templates folder. In this folder, you can find files that can be edited or overridden.
And, with this, we finally reach the end of the LearnDash ProPanel functionalities Pheww :)
LearnDash ProPanel Alternatives
LearnDash ProPanel helps you track your LMS data effectively. But it may not be the best option to help you with detailed insights about your learner’s progress and performance in your courses.
So for that, you can check out more advanced reporting solutions.
WISDM Reports for LearnDash
If you want to generate insightful course and learner progress reports, check out WISDM Reports for LearnDash.
This reporting and analytics plugin has the most comprehensive LearnDash reports that help you track and analyze learner progress and activity. It visualizes all the important data with the help of easy-to-understand graphs.
The most striking advantage of using this reporting plugin is that it offers customizable dashboards for admins, instructors, and group leaders. They can get all important reports in one view. Using this extension, you can also generate reports for a specific learner or a group of learners.
Features of WISDM Reports for LearnDash:
- User-specific dashboards – Admins, Instructors, and Group leaders get personalized dashboards with all important reports in one place.
- Graphical reports: Information is presented with easy to interpret and insightful graphs.
- Advance filters: Course, course category, quiz, quiz category, lesson, topics, and date-wise filters to understand learner performance in depth.
- Trends and learning behavior: Detailed course reports that allow you to track course completion rates, time spent on course modules, and course pass/fail rates. You can check the same for quizzes.
- Exportable reports: You can view, download, and share course/quiz performance reports for a specific learner or a group of learners.
- Time Tracking Module: Track your learner’s every move. Using the new ‘Time Tracking Module’ you can monitor how much time your students actually spend in your courses including the time they’re idle.
- Bulk Export for Quiz Results: Now exporting and analyzing quiz results is easier. Using the new bulk export feature you can easily export quiz attempt reports for all learners and all quizzes with just one click.
Must Read: WISDM Reports for LearnDash now includes highly requested features!
TinCanny Reporting for LearnDash
This is a powerful plugin that adds similar reporting features to your LearnDash website. It presents data in tabular format.
You can also enable your Group Leaders to access the reporting functions for their groups.
Features of the TinCanny Reporting plugin:
- Tin Can and SCORM 1.2 – If you’re using Storyline 2, Storyline 3, or Adobe Captivate 19 or 2017 to create modules, then this add-on is the real deal. It makes it convenient for you to track all data from WordPress itself. You don’t have to head to the third-party website.
- Dashboard Widget – View LearnDash course completion and Tin Can/SCORM statement quickly right from your dashboard.
- Course Reports – Easily track and monitor LearnDash course and activity reports. You can also make the reports available in the front end for your Group Leaders.
- Detailed User Reports – You can drill down and check out detailed LearnDash, Tin Can, and SCORM reports of individual users and courses.
- Front-end Quiz Reports – It presents a consolidated view of recorded LearnDash quiz scores to You, Group Leaders, or Learners.
Having said that, feel free to check out WISDM Reports for LearnDash and the TinCanny Reporting plugin for LearnDash. You can compare the two and pick the one that suits your requirements the best.
Want to compare which LearnDash reporting add-on is best for you? Read this article to find out everything?
Over to you,
I hope after reading this article you can easily set up LearnDash ProPanel.
You can take your business to great heights once you have the right and effective data. And LearnDash ProPanel can help you with that.
But it doesn’t necessarily guarantee the best way to report o LearnDash, So I recommend you to check out its alternatives as well. Here’s a list of the top 5 reporting plugins for LearnDash that are WORTH checking out.
Also, if you have any more questions about ProPanel, feel free to reach out in the comments section :)


