
Do you sometimes struggle to find in-depth LearnDash reports and insights? Are you tired of manually generating reports for your B2B clients to show employee progress over time?
You’re not alone.
Tracking student progress, activity, and performance in LearnDash can be overwhelming.
But thanks to various reporting tools, generating custom reports, evaluating learner performance, and sharing them with clients have become way easier.
Now the only thing left to do is decide which LearnDash reporting plugin is the best for your eLearning website.
So today, we’ll compare the two most popular LearnDash Reporting plugins – WISDM Reports VS Tincanny Reporting for LearnDash.
We’ll go over each plugin briefly, and then compare them head to head on the basis of pricing, features, and the reports that each plugin has to offer.
You can also try out their demos to get an idea of what course metrics will you be playing with and how they can help you make better e-Learning decisions.
By the end of this article you will know exactly which plugin has all the LearnDash reports you need and also the one that fits your budget.
So without further ado, let’s dive in!
WISDM Reports for LearnDash: Overview
WISDM Reports is a comprehensive reporting plugin that provides in-depth insights into learner activities and course performance. It offers a comprehensive reports dashboard that presents a graphical overview of learner and course performance, allowing administrators to quickly identify areas of concern and delve deeper into detailed reports on courses, learners, and quizzes.
The plugin also offers Gutenberg block-based reports, enabling users to customize and create multiple dashboards tailored to their specific needs.
One of the standout features of WISDM Reports is its ability to track the actual time spent in courses, while also logging the idle time your learners spend on your LMS. This feature ensures that learners are making progress and allows administrators to notify them if they are spending too much idle time.
Additionally, the plugin supports the export of reports to CSV and Excel formats, facilitating easy sharing of data and collaboration. With its strong reporting capabilities and user-friendly interface, WISDM Report is a powerful tool for any LearnDash user seeking to make data-driven decisions.
Demo
Here’s where you can check out the demo.
Pricing
| Plan | Annual | Lifetime |
| STARTER (1 Site) | $120 | $360 |
| BUSINESS (5 Sites) | $180 | $540 |
| AGENCY (10 Sites) | $220 | $660 |
Read More: 5 Amazing Reports in WISDM Reports for LearnDash
TinCanny Reporting for LearnDash: Overview
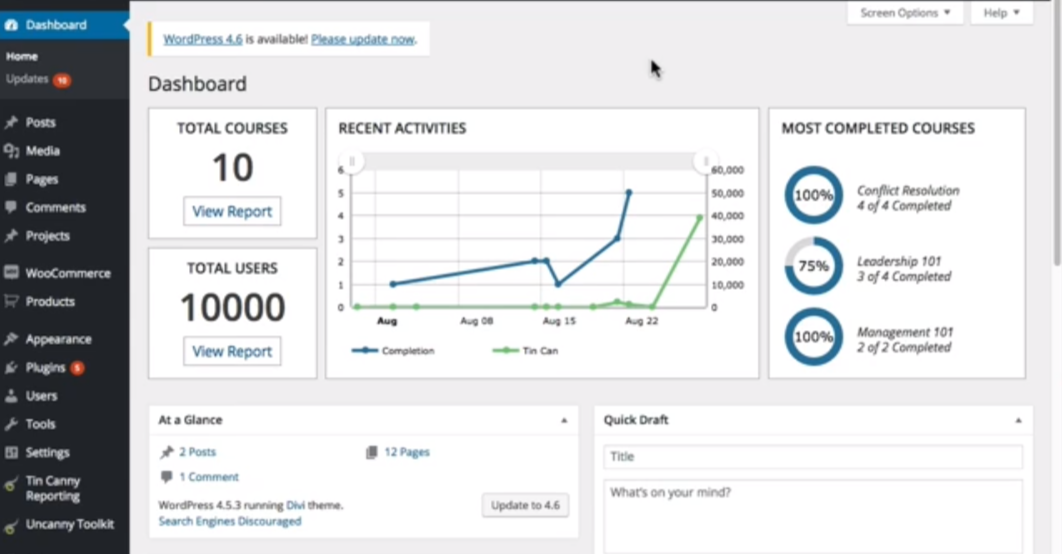
TinCanny Reporting is also a powerful reporting plugin that enhances the reporting capabilities of LearnDash sites for administrators and Group Leaders. It offers unique features like the Tin Can Report, which tracks the progress and completion of various eLearning modules, including Articulate Storyline/Rise, Adobe Captivate, iSpring, and H5P content. This plugin includes three different report views: Course Report, User Report, and Tin Can Report, offering a comprehensive overview of learner engagement and progress.
TinCanny Reporting can also track time with its integration with the Uncanny Simple Course Timer, allowing it to report how long it takes a user to complete a course and calculate the average completion time and total time spent by all users enrolled in the course.
This information is crucial for monitoring learner performance and determining whether the length of a course is reasonable. Additionally, all table data can be exported to CSV or Excel files. With its unique features, TinCanny Reporting is a valuable tool for any LearnDash user looking to enhance their eLearning program.
Demo
Not Available
Pricing
| Plan | Annual |
| SINGLE (1 Site) | $199 |
| BUSINESS (5 Sites) | $299 |
| AGENCY (50 Sites) | $399 |
| ALL ACCESS (2, 10, or 50 sites) | $399 |
WISDM Reports VS TinCanny Reporting: Comparison
Let’s dig into the functions of both plugins and see how they perform when it comes to providing details about courses and quizzes
| Features | TInCanny Reporting | WISDM Reports |
| Free Version Available | No | Yes |
| Starting Price | $120/year | $199/year |
| Graphical Reports | Yes | No |
| Export Option | Yes | Yes |
| Back End Access | Yes | No |
| Front End Access | Yes – Using ShortCode |
Yes – Frontend Reporting Dashboard |
| UI/UX (Bad, Average, Good, Great) | Average | Good |
| Scrom & H5P Compliant | Yes | No |
| Overview Report | Yes – Total Revenue Earned- Total Courses- Total Learners- Assignments Pending |
Yes – Courses- Users |
| Revenue From Courses | Yes- Total revenue for all course- Avg. revenue per course | Not Available |
| Daily Enrollments | Yes- Total Enrollments for a given date- Avg. Enrollment per day | Not Available |
| Time Spent On a Course | Yes – Total Courses- Completed All Courses- In Progress- Not Started Any Courses |
Yes – Enrolled- Completed- In Progress- Not Started- Avg. Completion Rate- Reporting in a table course-wise |
| Course Completion Rate | Yes – Total Quizzes- Courses- Avg Percentage of Quizzes Completed Per Course = Avg % of Quizzes Completed by learners in all courses/No. of Courses |
Not Available |
| Learner Pass Rate | Yes – Learners- Total Quizzes- Total Attempts (Pass & Fail)- Avg Pass Rate = Ratio of (Pass Attempts/Total Attempts) in all courses/No. of Courses |
Not Available |
| Quiz Completion Rate | Yes – Learners- Total Quizzes- Total Attempts (Pass & Fail)- Avg Pass Rate = Ratio of (Pass Attempts/Total Attempts) in all courses/No. of Courses |
Not Available |
| Quiz Completion Time | Yes – Total Courses- Avg. Time Spent on Quizzes all Courses- Avg Quiz Completion Time = Avg Time spent on quizzes in all courses/No. of Courses |
Not Available |
| Inactive Users List | Yes – Name- Email Id- Last Activity (Ranging from last 1 day to last 6 months |
Not Available |
| Learner Activity Log | Yes – Name- Email Id- Last Activity (Ranging from last 1 day to last 6 months |
Not Available |
| Frontend Quiz Reports | Yes | Yes |
| Detailed Quiz Reports | Yes – Course, Course Category- Completed Learners, In Progress, Not Started, % Completion- Avg. Total Time Spent – Avg. Completion Time – Avg Quiz Score- No. Of Quizzes – Quiz Time – Groups – Instructor |
Yes – Courses- Enrolled- Not Started, In Progress & Completed- Avg. Quiz Score- % Completed- Details |
| All Attempts Quiz Reports | Yes – Quiz Title- Student Name- Date of Attempt- Score- Time Taken |
Yes – Courses- Enrolled- Not Started, In Progress & Completed- Avg. Quiz Score- % Completed- Details |
| Student Dashboard | Yes | No |
| Group Leader Report | Yes | Yes |
| User Dashboard | Admin and Group Leader | Admin, Instructor, Group Leader, and Student |
| Demo Link | Not Available | View Wisdm Reports Demo |
| Plugin Overview Video | View Video | View Video |
| Purchase Link | Buy TinCanny Reporting | Buy WISDM Reports |
TinCanny Reporting VS WISDM Reports: Which is better in 2023?
Phew????
So that was all.
I hope this article helped you decide which reporting plugin is best for your LearnDash LMS.
In a nutshell, if you use different course authoring tools that are compliant with SCORM and xAPI and want to track more than just the basic LearnDash course and learner metrics, simply go with Tin Canny Reporting For LearnDash.
However, if you want a more comprehensive view of what’s happening on your LMS and need to generate custom reports to share with your B2B clients, then WISDM Reports for LearnDash is the best LearnDash reporting tool. WISDM Reports for LearnDash works in all scenarios such as – an online school, corporate training, and online course marketplace, among other things.
So choose the plugin that aligns with your e-Learning needs and vision for your course business.
If you want more insights or have any more questions, feel free to reach out to us.
That’s all for today.
See you in the next one. ?
Also Read: WISDM Reports vs LearnDash Gradebook: Grading the Graders