

With a deep sigh, Jordan logs into his LearnDash platform where he trains professionals who want to get certified and obtain a license.
He wants to check the staff employees’ course progress. But often finds himself overwhelmed with the training reports and analysis. Because to grant certificates, he has to ensure that the employees have gone through the course.
On the other hand, his customers have a lot of doubts about how their employees are doing in training. Are they performing well? Which employees need more attention? What courses are they struggling with?
And Jordan wishes he could share presentable performance reports with his customers so that they can easily understand how employees did on each course.
But his current LearnDash reporting tool requires him to first hunt through multiple tabs to capture the training metrics, crunch & organize numbers in a spreadsheet, and then process the data in order to make an informed decision.
This takes up most of his time and energy which he could use to focus on more impact-driven items.

Sound familiar? I felt it would.
The good news? There’s a fix for this problem.
A Reporting Dashboard where you can quickly check the training progress & performance, ensure engagement, and share training metrics with your customers.
And that’s why today, we’re going to cover how a reporting dashboard helps with training reporting and analysis in LearnDash.
So, let’s dive in?
Benefits of a reporting dashboard in LearnDash employee training
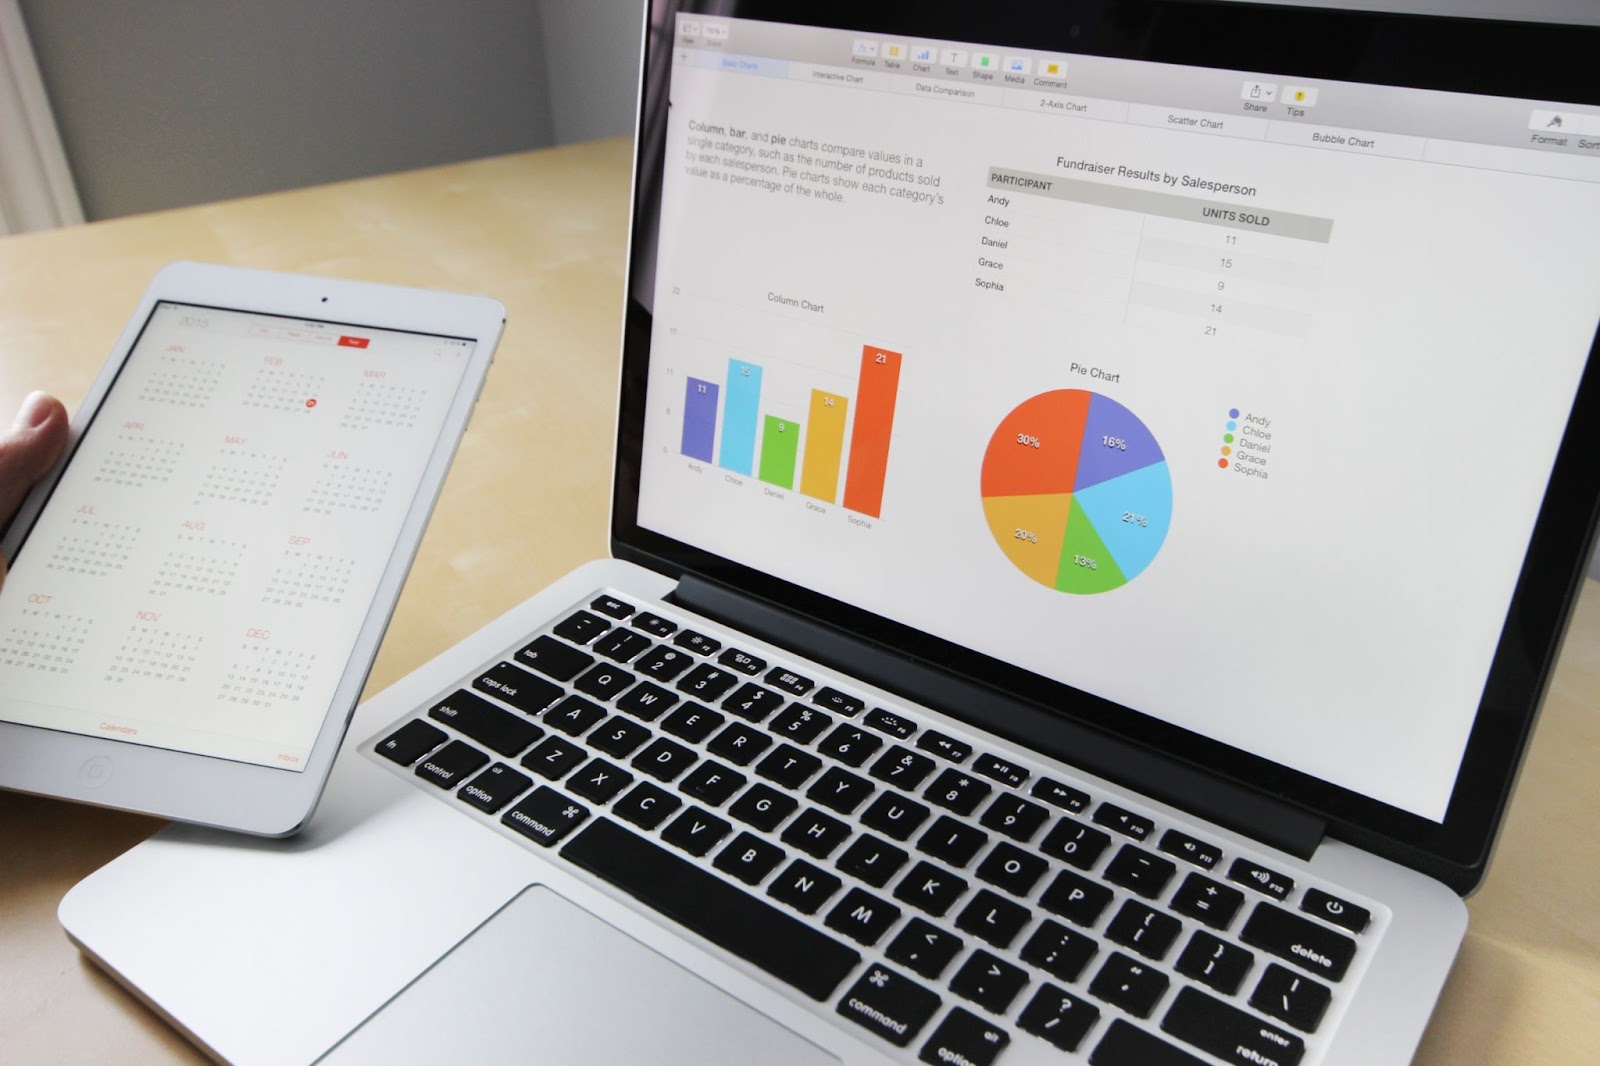
Visual data is quickly and easily interpreted.
Online reporting dashboards are a visual representation of what’s happening on your LMS. They present information regarding metrics or KPIs as graphs, or charts so that course instructors or other stakeholders can access information with just a glance at a screen.
Since the process of gathering data is automated, it makes analysis easy and buys back a big chunk of time. Thus they provide a fast way to see and comprehend learning metrics.
In a nutshell, a reporting dashboard can help you:
Monitor trends and learning activity
Tracking trends and learning activities of employees can help group leaders/managers see what courses team members have completed, not completed, or are in progress.
It also helps gain an understanding of how employees are spending their time by tracking the time spent on courses and the course completion rates.
Therefore, a dashboard helps understand how the employee learning behavior is changing.
Measure the impact of the training courses
A reporting dashboard helps understand the impact of your training program as well.
Training metrics such as avg. quiz scores, learner pass/fail rates, and quiz attempts indicate how employees comprehend the training material.
Do they find the training too hard? What courses are they struggling with? What quizzes are they failing?
Using a dashboard approach visualizes all important KPIs and helps focus on understanding the impact of learning.
Gain actionable insights
To gain insights you have to dig into e-learning data and find relationships & patterns to connect the dots.
A reporting plugin with a customizable dashboard provides more flexible filters so the user can narrow in on any report to view key obstacles and insights.
Course progress reports & course completion time graphs with the lesson and topic filters as well as quiz attempt graphs, quiz pass rate graphs, and quiz completion time graphs with learner-specific filters highlight which employees are taking more time than usual, identify drop-off or disengagement points and indicate whether learners are at risk to provide help in case needed.
Read more: How to Get Insights from your LearnDash Analytics Data
Now that we’ve understood the benefits of a reporting dashboard, let’s look at how it simplifies training analysis.
4 ways dashboard reporting simplifies training analysis in LearnDash
1. Get all metrics that matter in one view with dashboard reports for Admins, Instructors, and Group leaders
With access to a dashboard, Admins, Instructors, and Group Leaders get access to all important reports under one view.
This graphical overview with all measurable training metrics like learner and course performance helps detect any fluctuations in the learning behavior at a glance.
A dashboard allows users (Admin, Instructor, or Group Leader) to access reports specific to their needs. Therefore, users don’t have to hunt for data in different places. Hence, saving time and making navigation easier.
2. View graphical reports with visual insights to comprehend learning activity and engagement
The graphical reports on the dashboard help summarize learning trends with metrics like course completion rates, course completion time, quiz completion rates, and quiz completion time.
Additionally, reporting data like avg. quiz attempts and avg. learner pass/fail rate helps understand which course the employees are struggling with so that you can assist them in their e-learning journey and improve training outcomes.
The learning trends and course engagement metrics reveal insights like which training courses take too long to finish, and whether or not the employees are spending enough time in the courses.
Pro Tip: You can use these insights and ensure that employees have spent enough time in training modules to grant certificates.
4. Use configurable search fields & dashboard filters to understand employee progress in training courses and quizzes
To further simplify training analysis, customizable dashboard filters help you dig into each lesson/topic of a particular course and ensure whether employees have gone through the course.
While training online, it’s critical to pay attention to each employee. With specific filters, you can deep dive into the performance of individual learners and track their performance on courses and quizzes.
Using the filters, group leaders can also check the course progress and quiz performance of their respective groups.
Pro Tip: Using the insights offered by these filters, you can also identify top-performing learners and highlight them on a leaderboard to motivate other employees.
Read more: How a Dashboard can simplify LearnDash Quiz Reporting
4. Export reports for further employee reporting and analysis
Lastly, a reporting dashboard allows exporting of training progress and performance reports.
Users like Admins, Group Leaders, and Instructors can download course-specific reports, learner-specific reports, group-wise reports, and quiz performance reports as CSV & Excel.
Therefore, you can download and share reports with stakeholders to study employee performance further.
Summing up
Dashboard reporting that helps track live data gives you the newest insights rather than waiting until month-end reports to come out. So you can be updated and update your clients on the go.
Moreover, using dashboards to track progress allows training professionals to measure their alignment with their training goals.
So what are you waiting for? Check out these top 5 reporting plugins that can equip you with a robust reporting dashboard.
Our pick? —- WISDM Reports for LearnDash, it has an immersive repoting dashboard that can make a massive impact on your training analysis. It saves you loads of time and simplifies reporting by putting a visual picture to your training numbers.
Try it for yourself and let us know your thoughts below.