Planning, organizing and managing an event was once left to the expertise of event management companies that relied solely on the skills of people for completing various tasks and duties. Although not much has changed today, there is one small technological development that’s making event management a lot easier – WordPress – or rather the Event Espresso plugin for WordPress.
About Event Espresso

Event Espresso is an online event registration and attendee management plugin by WordPress. It manages the registrations, bookings, and variable pricing for all kinds of events. Be it a marathon, an art workshop, a self-help course, large-scale conference, or a fundraiser, this plugin is very useful and highly-customizable.
Event Espresso has been developed dynamically and is currently in its 4th version – Event Espresso 4 Decaf. It consists of various plugins that assist in its functions, one of them being Reports and Analytics.
In this article, we are going to review the Easy Reports and Analytics plugin for EE4 Decaf.
What is the Easy Reports and Analytics plugin for EE4?
 The Easy Reports and Analytics plugin basically performs the function of presenting all the statistical and analytical data related to the event, to the organizer, instantly at the front end of the site.
In a normal scenario, the event organizer has to access all the event-related numbers at the back-end of the website. This entails wading through a lot of other unnecessary data that is of no current relevance and just contributes to making the process tedious. And let’s not forget the amount of time that’s wasted in this ordeal.
So what does the Easy Reports and Analytics plugin do exactly? Let’s check out its features!
Features of the Reports and Analytics plugin
An Interactive Interface

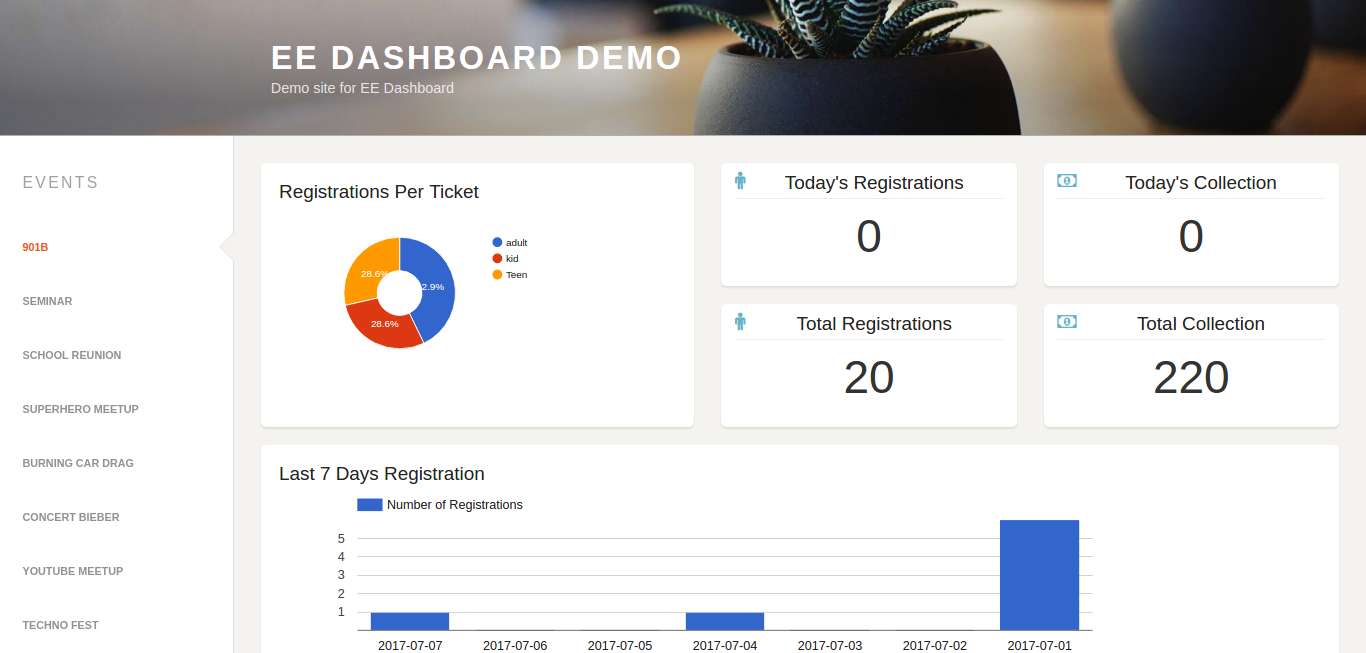
The plugin’s interface is smart and intuitive. It has been greatly simplified for instant access to, and understanding of, the information that’s displayed to you. You don’t need to go through all the fields a zillion times to make sense of what is displayed on your screen until the numbers start twirling in front of your eyes. All the categories are organized close together and the relevant information is highlighted. It has Today’s Registrations, Today’s Collections, Total Registrations, and Total Collections as the fields.
Time Saving
As mentioned above, you can save a lot of time spent in trying to find what you’re looking for at the back end. This plugin instantly procures all the basic statistics of the event for you to view.
Instant Access
The plugin takes you to the Statistics and Outcome page as soon as you select the relevant option. Say goodbye to precious time wasted at the inconvenient back end trying to access the stats before it consumes you instead!
Smart Analytics

The Easy Reports and Analytics plugin allows you to set various parameters for calculating statistics, such as age, ticket cost, time of the day, day of the week, etc. Whatever you segregate it by, the analytical data is available to you in that form.
Real-time Updates
This is a fun one! Once you have created the events and opened up registrations, you can actually sit and keep a watch on the page. You will be able to see any spikes and drops in registrations, which can help you understand user behaviour. Do more people register at a particular time, or on a particular day? Or the average age of your users too. Exciting, isn’t it?
The Event in a Nutshell
The plugin presents an entire summary of how your event fared from the time of registrations to the time of closing. It displays this information in the form of charts and graphs that are interactive, attractive, and easy to read. You can understand whether the event was as you had hoped or not, statistically.
Easy Access
Both the website admin and the event admin have perpetual access to the statistical data. They can simply log into the site, go to reports and analytics, and view any of this information.
Responsive

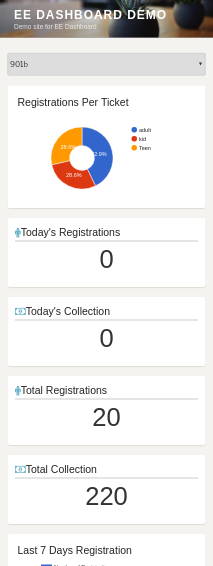
The Easy Reports and Analytics plugin is mobile responsive. Just log into the site from your phone and get all the numericals anytime, anywhere.
In conclusion
The Reports and Analytics plugin is a free download that’s easy to install and integrate on your EE4 plugin. It is mandatory plugin that works with Event Espresso version 4.9 and higher. Save yourself the hassles of a complicated back-end and get all your event stats upfront by using this convenient and free plugin.


One Response
urgently, can I make a free ticket ?