- This Gutenberg block shows the summary of time spend on each of the courses, the data will be represented in the form of a pie chart for course wise time spent when a single course is selected from the filters the same block shows the bar chart listing the time spent by each learner on the selected course.
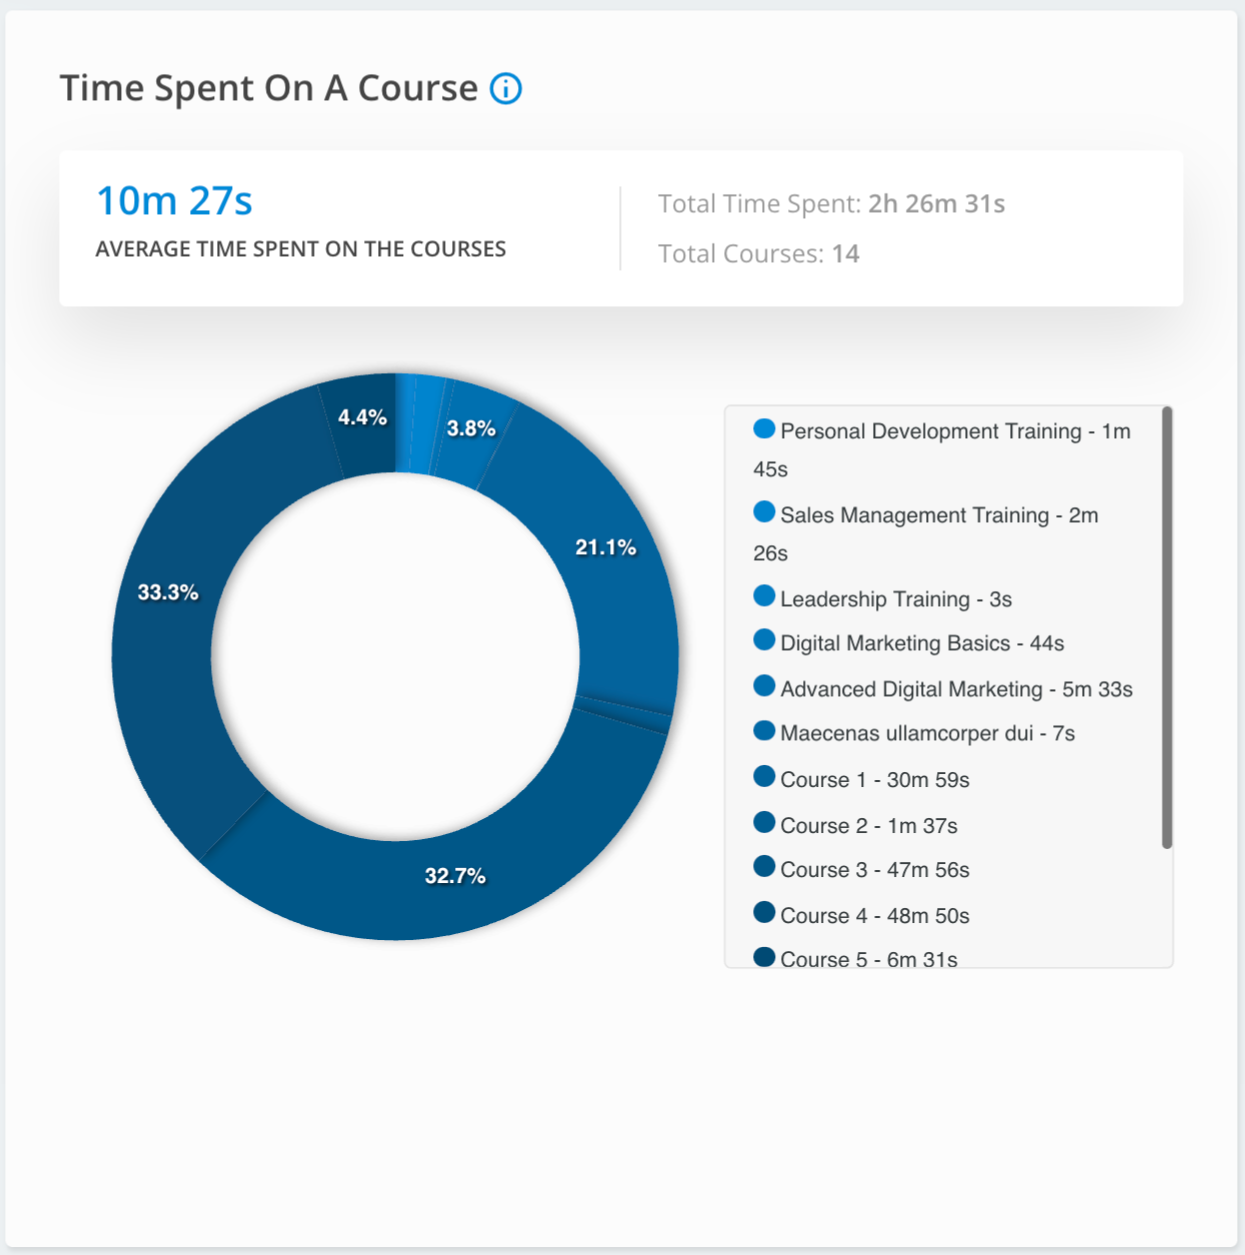
- The graph for the time spent by the learners on each Course.
- The Insight – ‘Average Time spent per Course’ is the total time spent by all users on all courses divided by the total number of courses.
- For example – The total time spent on all courses by all users is 120 minutes and there are 5 courses, and the Avg is 24 mins.
- Benefits: To check if students are actually taking courses, to check what is the minimum time students spend on courses before completing the course.