shvsh > /home/1168859.cloudwaysapps.com/rcyqmhwrmv/public_html/docs/wp-content/plugins/ht-knowledge-base/ht-knowledge-base.php

Quiz Completion Rate Block

  • This Gutenberg block shows a bar chart listing all the courses with respect to their % completion rate, when an individual course is selected it shows the pie chart indicating the completion statuses of the quizzes (Completed/Incomplete)
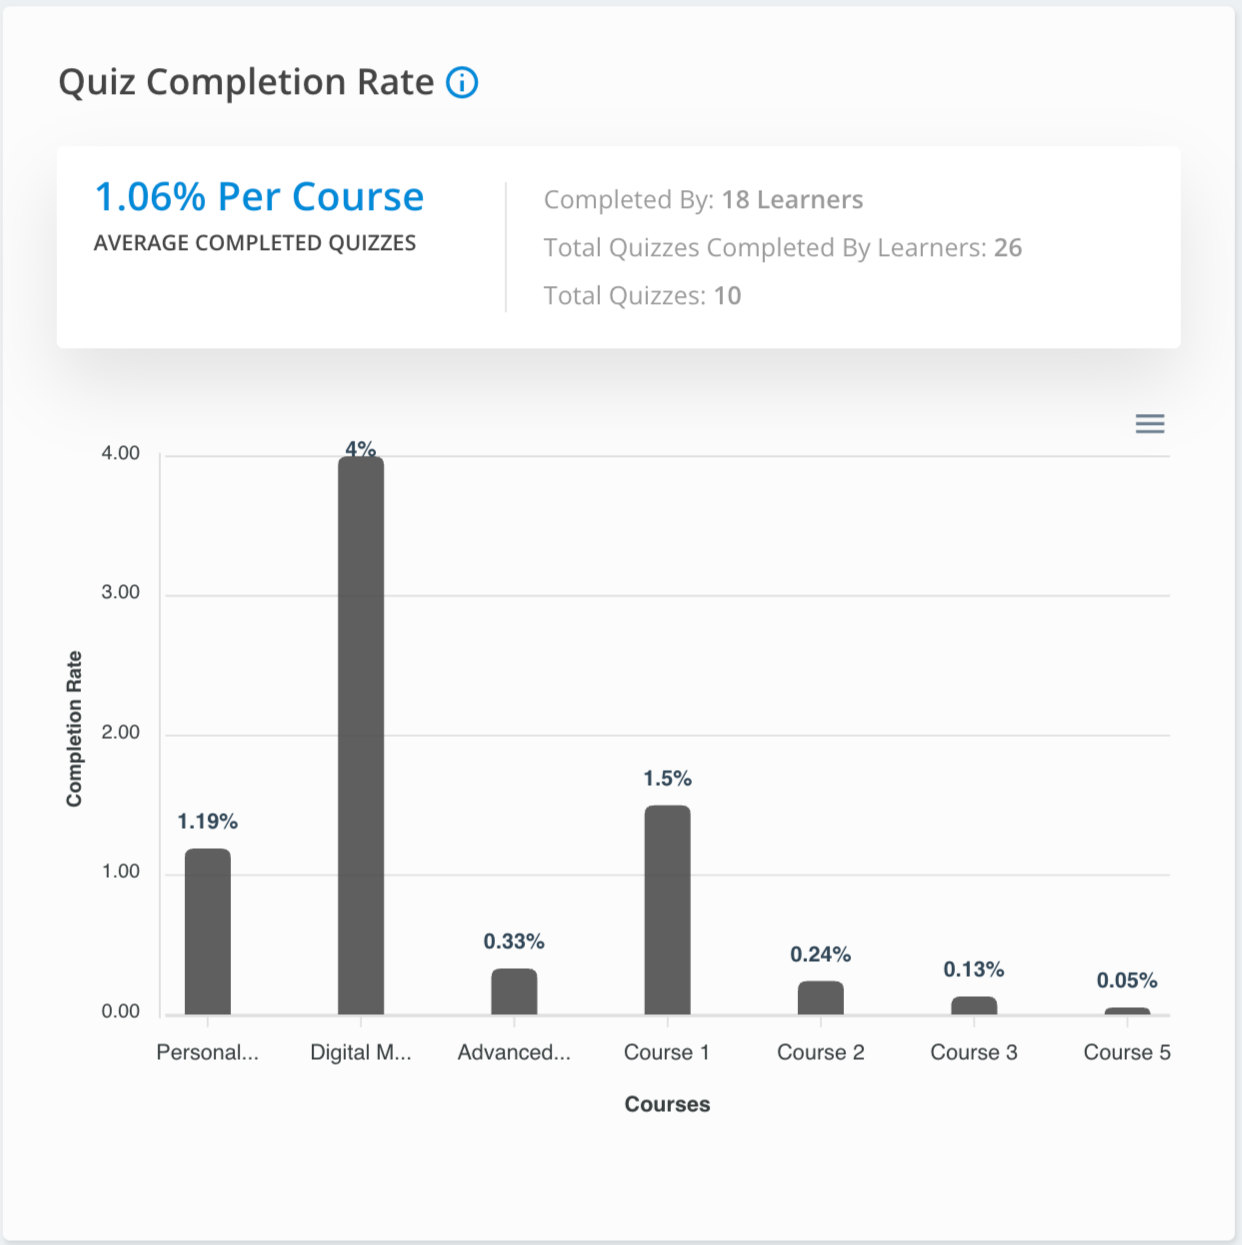
  • The graph for the percentage of Learners who have completed all Quizzes in each Course. 
  • The insight – ‘Average percentage of Quiz Completion’ is the average of the percentage of learners who have completed all the quizzes in each course.
  • For example – In 3 courses, 5%, 10%, and 15% of the students completed all quizzes, the avg is 10%.
  • Benefits: To check which course is easy for students to complete and which course is difficult based on the number of students who have completed all quizzes for a course. 
Updated on April 11, 2022
shvsh > /home/1168859.cloudwaysapps.com/rcyqmhwrmv/public_html/docs/wp-content/plugins/ht-knowledge-base/ht-knowledge-base.php

Was this article helpful?

shvsh > /home/1168859.cloudwaysapps.com/rcyqmhwrmv/public_html/docs/wp-content/plugins/ht-knowledge-base/ht-knowledge-base.php

Related Articles