shvsh > /home/1168859.cloudwaysapps.com/rcyqmhwrmv/public_html/docs/wp-content/plugins/ht-knowledge-base/ht-knowledge-base.php

Quiz Completion Time

  • This block displays the average time spent on the quizzes & lists the bar chart showing time spent on the quizzes of each of the courses by their learners, When a peculiar course filter is applied the ar chart shows the time taken by each user to complete the course quizzes.
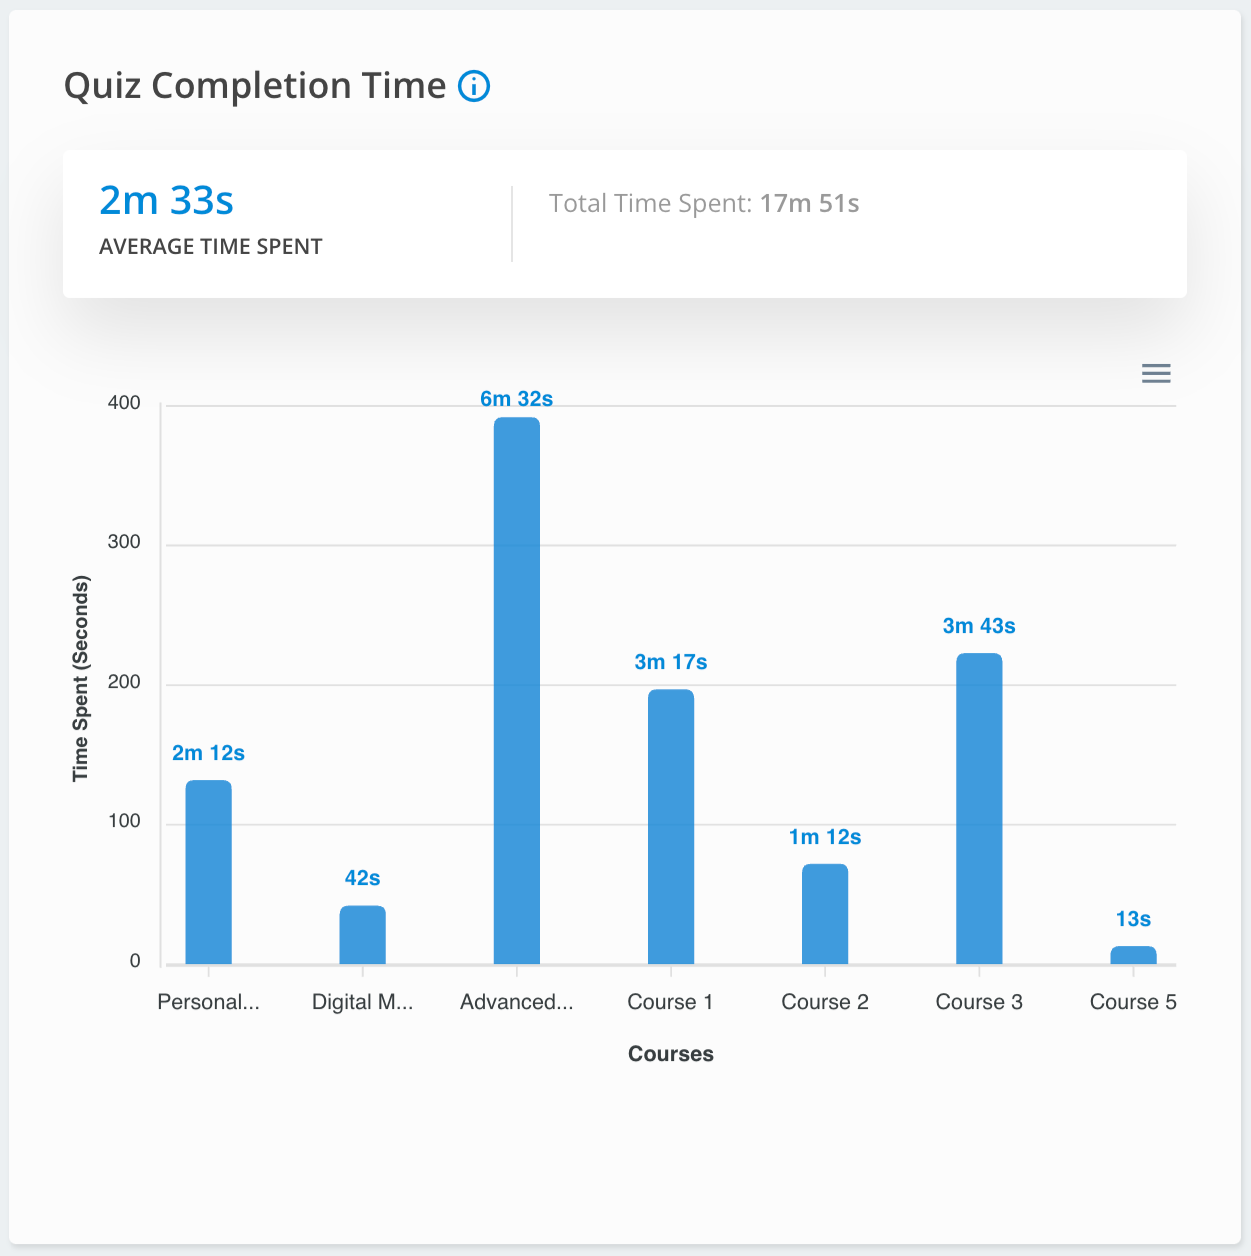
  • The graph for total time spent by the Learners on Quizzes (to complete the quiz) in each Course. 
  • The insight – ‘Average Quiz Completion Time per Course’ is the average of the aggregate time it took the students to complete quizzes in each individual course divided by the total number of courses.
  • For example – The aggregate time it took for users to complete the quizzes in each course for 3 courses is 10, 20, and 30 mins respectively,, and the avg is 20 mins.
  • Benefits: To check which quizzes are tough and hence are taking more time to complete. 
Updated on April 11, 2022
shvsh > /home/1168859.cloudwaysapps.com/rcyqmhwrmv/public_html/docs/wp-content/plugins/ht-knowledge-base/ht-knowledge-base.php

Was this article helpful?

shvsh > /home/1168859.cloudwaysapps.com/rcyqmhwrmv/public_html/docs/wp-content/plugins/ht-knowledge-base/ht-knowledge-base.php

Related Articles