shvsh > /home/1168859.cloudwaysapps.com/rcyqmhwrmv/public_html/docs/wp-content/plugins/ht-knowledge-base/ht-knowledge-base.php

Revenue From Courses

  • This Gutenberg block summarizes the earrings for the selected timeframe, and shows the line graph with earnings per course, along with the second line on the graph showing the earnings in the past if available.
Revenue earned per course
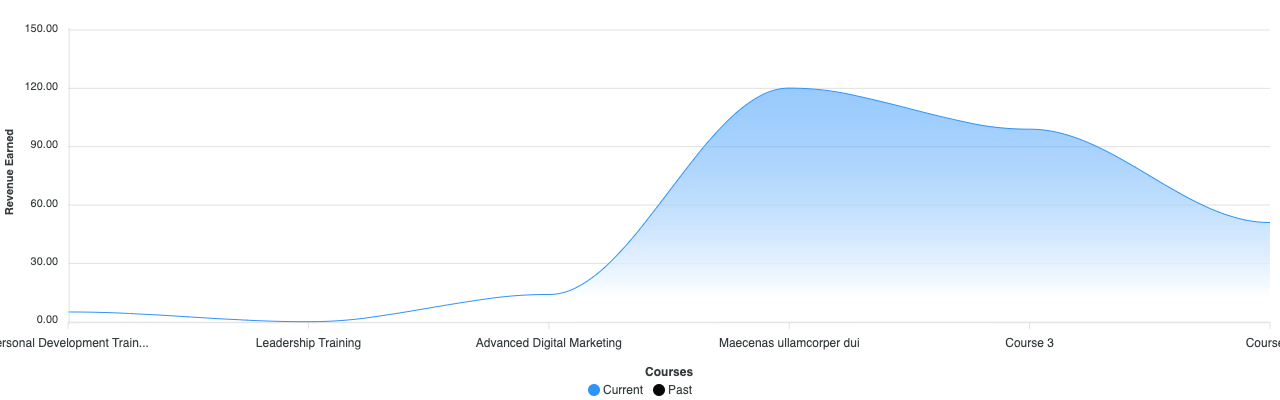
  • The graph for the Revenue earned Course-wise for the selected date range. 
  • The insight – ‘Average Revenue per course’ is the total revenue generated by each individual course divided by the total number of courses. (with an increment/decrement metric as compared to the previous time period)
  • For example – The total Revenue generated by all the courses is $1000 and there are 5 total courses so the Avg is $200.
  • Benefits: To check for top revenue-generating courses, AOV.

Updated on April 11, 2022
shvsh > /home/1168859.cloudwaysapps.com/rcyqmhwrmv/public_html/docs/wp-content/plugins/ht-knowledge-base/ht-knowledge-base.php

Was this article helpful?

shvsh > /home/1168859.cloudwaysapps.com/rcyqmhwrmv/public_html/docs/wp-content/plugins/ht-knowledge-base/ht-knowledge-base.php

Related Articles